
Center and Variability Practice
Presentation
•
Mathematics
•
9th - 12th Grade
•
Medium
Standards-aligned
Amanda Ethridge
Used 20+ times
FREE Resource
3 Slides • 17 Questions
1
Median and IQR
Median - the middle value in an ordered data set
●Roughly 50% of the data is below and above the median
●Measures the typical value for data in a skewed distribution
●NOT influenced by all data values
Interquartile Range (IQR) - the middle 50% of the data in a distribution
●Found by subtracting the 1st quartile (Q1) from the 3rd quartile (Q3)
●Measures the variability of a sample with a skewed distribution
2
Multiple Select
Select the (2) measures of CENTER.
Mean
Median
IQR
Standard Deviation
3
Multiple Select
Select the (2) measures of VARIABILITY.
Mean
Median
IQR
Standard Deviation
4
Appropriate Measures of Center and
Variation
The shape of the distribution determines which measure of center
and variability are best.
Use the mean and standard deviation for symmetrical distributions.
Use the median and IQR for skewed distributions or distributions that have outliers.
5
Multiple Choice
If there is an Outlier in the set which measure of CENTER would you use?
Mean
Median
IQR
Standard Deviation
6
Comparing Measures of Center
●
In a symmetric distribution, the mean and the median are
approximately the same.
●
In a right skewed distribution the mean tends to be greater than the
median.
●
In a left skewed distribution the mean tends to be less than the
median.
7
Multiple Choice
If there is an Outlier in the set which measure of VARIABILITY would you use?
Mean
Median
IQR
Standard Deviation
8
Multiple Choice
If there is NOT an Outlier in the set which measure of VARIABILITY would you use?
Mean
Median
IQR
Standard Deviation
9
Multiple Choice
If there is NOT an Outlier in the set which measure of CENTER would you use?
Mean
Median
IQR
Standard Deviation
10
Multiple Select
Which measurements would represent the BEST measures of center & variability for the data set shown?
26, 29, 24, 33, 31, 43, 17, 84, 23, 27, 29
Mean
Median
IQR
Standard Deviation
11
Multiple Select
Which measurements would represent the BEST measures of center & variability for the data set shown?
8, 7, 6, 5, 4, 4, 3, 2, 9, 7
Mean
Median
IQR
Standard Deviation
12
Multiple Select
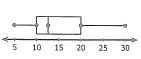
Study the graph and determine one measure of center and one measure of variability that would best describe the data. (hint: are there outliers?)
Standard Deviation
Median
Mean
IQR
13
Multiple Choice
14
Multiple Choice
15
Multiple Choice
16
Multiple Choice
Type of Data arrangement
Symmetrical
Hairline
Skewed Right
Skewed Left
17
Multiple Choice
Which of the following best describes the shape of the distribution?
SKEWED LEFT
SKEWED RIGHT
SYMMETRICAL
18
Multiple Choice
19
Drag and Drop
20
Drag and Drop
Median and IQR
Median - the middle value in an ordered data set
●Roughly 50% of the data is below and above the median
●Measures the typical value for data in a skewed distribution
●NOT influenced by all data values
Interquartile Range (IQR) - the middle 50% of the data in a distribution
●Found by subtracting the 1st quartile (Q1) from the 3rd quartile (Q3)
●Measures the variability of a sample with a skewed distribution
Show answer
Auto Play
Slide 1 / 20
SLIDE
Similar Resources on Wayground
12 questions
6.1-6.3 Normal Distribution review
Presentation
•
10th - 12th Grade
16 questions
Unit 9 Statistics Vocabulary
Presentation
•
9th - 12th Grade
16 questions
Residual Plots
Presentation
•
10th - 12th Grade
16 questions
5.1 to 5.4 Geometry
Presentation
•
9th - 12th Grade
16 questions
Dot Plot Review
Presentation
•
9th - 12th Grade
14 questions
Qualitative VS Quantitative Variables
Presentation
•
10th - 12th Grade
12 questions
Before Darwin Build Up to Evolution
Presentation
•
9th - 12th Grade
12 questions
Unit 8 Lesson 1
Presentation
•
9th - 12th Grade
Popular Resources on Wayground
19 questions
Naming Polygons
Quiz
•
3rd Grade
10 questions
Prime Factorization
Quiz
•
6th Grade
20 questions
Math Review
Quiz
•
3rd Grade
15 questions
Fast food
Quiz
•
7th Grade
20 questions
Main Idea and Details
Quiz
•
5th Grade
20 questions
Context Clues
Quiz
•
6th Grade
20 questions
Inferences
Quiz
•
4th Grade
19 questions
Classifying Quadrilaterals
Quiz
•
3rd Grade
Discover more resources for Mathematics
5 questions
A.EO.1-4 Quizizz Day 1
Quiz
•
9th - 12th Grade
5 questions
A.EO.1-4 Quizizz Day 2
Quiz
•
9th - 12th Grade
20 questions
Simple Probability
Quiz
•
10th Grade
15 questions
8th Grade Math EOG Review (calculator inactive)
Quiz
•
8th - 9th Grade
20 questions
Algebra 1 Review
Quiz
•
9th Grade
30 questions
Geometry Final Exam Review
Quiz
•
10th Grade
25 questions
Algebra 1 EOC Review
Quiz
•
8th - 10th Grade
5 questions
A.EO.1-4 Quizizz Day 4
Quiz
•
9th - 12th Grade