Search Header Logo
SPA 1.1-1.4 REVIEW

SPA 1.1-1.4 REVIEW

Assessment

Presentation

Mathematics

KG

Easy

CCSS
HSS.IC.B.3, RI.1.6, 6.SP.B.5A

+16

Standards-aligned

Created by

Kelsey Hanna

Used 1+ times

FREE Resource

26 Slides • 32 Questions

1

media

2

media

3

media

4

Multiple Choice

Which of the following is not a part of the the Statistical Problem-Solving Process?

1

ask questions

2

collect data

3

analyze data

4

interpret results

5

make infographics

5

media

6

Multiple Choice

Question image

According to the Internet Movie Database, Avatar is tops based on box-office receipts worldwide. The table displays data on several popular movies. Identify the individuals in this data set.

1

The movie titles

2

The year

3

The rating

4

The Genre

5

The running time

7

Multiple Choice

Question image

According to the Internet Movie Database, Avatar is tops based on box-office receipts worldwide. The table displays data on several popular movies. Identify the variables in this data set.

1

Movie titles, year, ratings, time, and genre

2

Year, ratings, time, genre, and box office earnings

3

Movie titles, ratings, and genre

4

Year, time, and box office earnings.

8

media

9

media

10

Multiple Choice

Question image

According to the Internet Movie Database, Avatar is tops based on box-office receipts worldwide. The table displays data on several popular movies. Identify the categorical variables in this data set.

1

Movie titles, year, ratings, time, and genre

2

Year, ratings, time, genre, and box office earnings

3

Ratings and genre

4

Year, time, and box office earnings.

11

Multiple Choice

Question image

According to the Internet Movie Database, Avatar is tops based on box-office receipts worldwide. The table displays data on several popular movies. Identify the quantitative variables in this data set.

1

Movie titles, year, ratings, time, and genre

2

Year, ratings, time, genre, and box office earnings

3

Ratings and genre

4

Year, time, and box office earnings.

12

media

13

media

14

media

15

media

16

media

17

Multiple Choice

Which of the following is NOT something you do to make a bar chart.

1

draw and label axes

2

scale the axes

3

draw bars

4

calculate the median

18

media

19

media

20

media

21

Multiple Choice

Question image

How many mountain bikes were sold?

1

22

2

16

3

28

4

6

22

Multiple Choice

Question image

According to this graph, what is the most popular flavor of Jolly Rancher?

1

Cherry (Red)

2

Blue Raspberry (Blue)

3

Grape (Purple)

4

Apple (Green)

23

media

24

Multiple Choice

A common mistake with bar charts is to...

1

turn the bars into pictures

2

use different colors for each bar

3

make the vertical axis start at 0

25

media

26

media

27

media

28

Multiple Choice

Which of the following is not something you do to create a dot plot?

1

Draw and label the axis

2

make the dots different colors

3

Scale the axis

4

Plot the values.

29

media

30

Multiple Choice

Question image

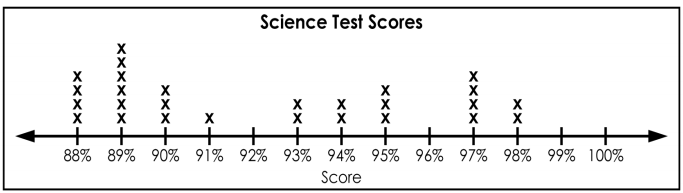
What is the shape of the dot plot shown?

1

skewed left

2

skewed right

3

symmetrical

31

Multiple Choice

Question image

What shape is the dot plot for SUV's?

1

skewed right

2

skewed left

3

symmetrical

4

none of the above

32

Multiple Choice

Question image

What is the shape of the data for Small Dogs?

1

Skewed Left

2

Skewed Right

3

Symmetric

4

Circular

33

Multiple Choice

Question image
Which statement correctly describes the shapes of the dot plots for cars and SUVs?
1
SUVs: symmetrical
Cars: skewed left
2
Both are skewed left
3
Both are symmetrical
4
SUVs: skewed right
Cars: Skewed left

34

media

35

media

36

Multiple Choice

Question image

how many people voted in this dot plot

1

4

2

9

3

3

4

not here

37

Multiple Choice

Question image
How many students received a score of 94%? 
1
94
2
4
3
1
4
2

38

media

39

media

40

media

41

media

42

Multiple Choice

What is another name for a stem-and-leaf plot?

1

Bar graph

2

Line graph

3

Stemplot

4

Pie chart

43

Multiple Choice

What does splitting stems in a stemplot help with?

1

Making the stemplot look more organized

2

Showing the shape of the distribution more clearly

3

Reducing the number of stems needed

4

Comparing two distributions

44

Multiple Choice

What should be considered when splitting stems in a stemplot?

1

The number of possible leaf digits for each stem

2

The total number of data values

3

The range of the data set

4

The mean of the data set

45

Multiple Choice

What is a back-to-back stemplot used for?

1

Comparing two distributions

2

Displaying a single distribution

3

Showing the mean and median of a data set

4

Splitting the data into stems and leaves

46

Multiple Choice

Question image

A class of students wanted to see if caffeine would increased their pulse. They measured their pulses before and after drinking a caffeinated soda. The data is represents in the back to back stemplot.

Key: 14|6 = 146 beats per minute (bpm)

Which of the following statements best compares the before and after distribution of pulse rate?

1

-After is roughly skewed to the right while Before is fairly symmetric.

-After has one potential outlier at 146 bpm.

  • - The center of After is less than the center of Before.

  • - The variability of Before is smaller than the variability of After.

2

-Both data distributions are roughly skewed to the right.

-After has one potential outlier at 146 bpm.

  • - The center of After is higher than the center of Before.

  • - The variability of Before is smaller than the variability of After.

3

-Both data distributions are roughly skewed to the right.

-After has one potential outlier at 146 bpm.

  • - The center of After is higher than the center of Before.

  • - The variability of Before is much larger than the variability of After.

47

media

48

Multiple Choice

What is statistics?

1

The science and art of collecting, analyzing, and drawing conclusions from data

2

The study of roller coasters

3

The process of asking questions and collecting data

4

The distribution of a variable

49

Multiple Choice

What is the first step in the statistical problem-solving process?

1

Analyze data

2

Ask questions

3

Interpret results

4

Collect data

50

Multiple Choice

What does a relative frequency table show?

1

The count of individuals having each data value

2

The proportion or percent of individuals having each data value

3

The pattern of variation of values a variable takes

4

The average value of a variable

51

Multiple Choice

Question image

What percent of students had more than 6 candy bars?

1

20%

2

30%

3

80%

4

45%

52

Multiple Choice

What does the distribution of a variable tell us?

1

The count of individuals having each data value

2

The proportion or percent of individuals having each data value

3

The pattern of variation of values a variable takes

4

The average value of a variable

53

Multiple Choice

Question image
What is wrong with this stem and leaf diagram?
1
Nothing- it's all correct.
2
The order.
3
It's missing a key.
4
The title.

54

Multiple Choice

What type of graph is used to display categorical data?

1

Line chart

2

Bar chart

3

Scatter plot

4

Histogram

55

Multiple Choice

What is an outlier?

1

A value that falls outside the overall pattern

2

The highest value in the data set

3

The lowest value in the data set

4

The average value of the data set

56

Multiple Choice

What is a quantitative variable?

1

A variable that assigns labels to individuals

2

A variable that takes number values

3

The count of individuals having each data value

4

The proportion or percent of individuals having each data value

57

Multiple Choice

What is an individual in a data set?

1

A person, animal, or thing described in a set of data

2

A variable that takes number values

3

The count of individuals having each data value

4

The proportion or percent of individuals having each data value

58

Multiple Choice

Question image

What is the highest ticket price?

1

$35

2

$12

3

$49

4

$40

media

Show answer

Auto Play

Slide 1 / 58

SLIDE