
Graphing Motion
Presentation
•
Science
•
8th Grade
•
Easy
+4
Standards-aligned

Whitney Price
Used 63+ times
FREE Resource
5 Slides • 16 Questions
1

2

3

4
Multiple Choice
5
Multiple Choice

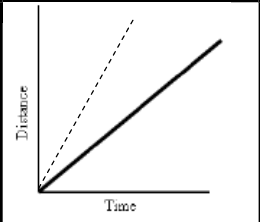
Describe the motion in the graph:
6
Multiple Choice

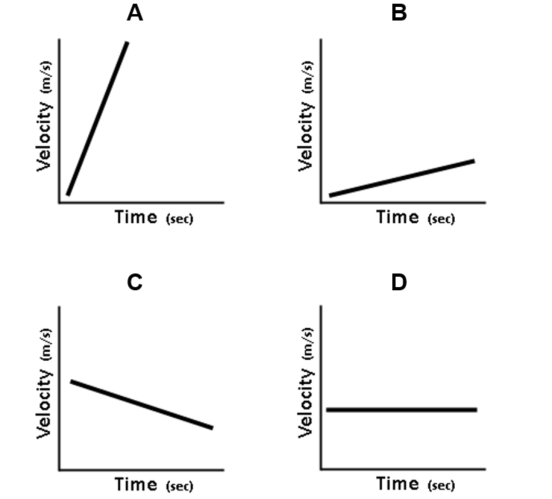
Describe the motion in the graph:
7
Multiple Choice

During which segment is the object moving at the greatest speed?
8
Multiple Choice
During which segment is the object motionless?
9
Multiple Choice
Compared to L, during segment N the object is moving -
10
Multiple Choice

During which segment is the object moving at the fastest speed?
11
Multiple Choice
During which segment is the object moving at the slowest speed?
12
Multiple Choice
During which segment is the object stationary?
13

14

15
Multiple Choice

Which best describes the objects motion?
16
Multiple Choice

What is happening at 4 seconds?
17
Multiple Choice

18
Multiple Choice
19
Multiple Choice

During which segment is the object increasing speed?
20
Multiple Choice
During which segment is the object decreasing speed?
21
Multiple Choice
During which segment is the object travelling at constant speed?
Show answer
Auto Play
Slide 1 / 21
SLIDE
