

Quadratic Relationships 4b-1

Presentation
•
Mathematics
•
12th Grade
•
Practice Problem
•
Hard

Joedi Coleman
Used 1+ times
FREE Resource
15 Slides • 17 Questions
1

A.FGR.7.1, A.FGR.7.3, A.FGR.7.4, A.FGR.7.6
In this lesson, you will recognize, describe, and identify key attributes of quadratic relationships using graphs, equations, or descriptions of the functions.
2
Multiple Select
Select all the graphs showing relations that are also functions.
3

All of these images show arc-like paths in the real world. These paths can be modeled by quadratic functions.
In this lesson, we'll explore quadratic functions and some of the features of their graphs.
Introduction
4

The graph of a quadratic function, a parabola, is U-shaped. It can open upward or downward.
Notice that each element in the domain of the graphed quadratic function is paired to exactly one element of the range. So, a parabola is a function.
Observe the domain and the range of the parabola:
Domain. The graph of a quadratic function exists for all x-values, so the domain is all real numbers.
Range. The graph of the function also exists for all real y-values greater than or equal to -3. Therefore, the range of the function is y ≥ -3.
Note that no matter how a quadratic function is shifted, these two statements are true:
The domain will remain the same.
The range will change only as a quadratic function shifts up or down.
Quadratic Functions
5

We can also evaluate a quadratic function for an element in its domain. To do so, replace the variable of the function with the element each time the variable occurs.
For the given function, for example, find f(-2) by substituting -2 for x in the function. Use the order of operations to simplify.
Evaluating Quadratic Functions
6

Take a look at the graph of the function. The point (-2 , -2 ), which lies on the graph, also shows that f(-2) =-2.
Evaluating Quadratic Functions
7
Fill in the Blanks

The shape of the graph is called a
Type answer...
8
Math Response
The domain of the function is the set of all real numbers, and the range of the function is the set of all real numbers greater than or equal to
9
Math Response
When x = -1, f(x) =
10

Before we start looking at how to find the intercepts and other key features of quadratic functions, let’s review how to find the intercepts of a linear function. Recall that y = f(x).
First, find the x-intercept of the function by setting y equal to 0 and solving for x.
Similarly, find the y-intercept by setting x equal to 0 and solving for y.


11

This is the graph of the function. Notice that it crosses the x-axis at
x = 4 and the y-axis at y = 3.
12

Now, let’s explore how to find the intercepts of a quadratic function.
First, find the intercepts by observing where the graph of the function crosses the axes. In the given graph, the function crosses the x-axis at x = -2 and x = 2. It crosses the y-axis at y = 4.
Let’s now consider the same function but solve for the intercepts algebraically. Substitute 0 for f(x) and solve for x to determine the x-intercepts.

13
Now, substitute 0 for x and solve for f(x) to determine the y-intercept.
Quadratic functions always have one y-intercept, but can have zero, one, or two x-intercepts.
14
Multiple Choice
The graph of function g has x-intercepts at x = -1 and x = 3 and a y-intercept at y = -3. Select the graph that could model function g.
15

16
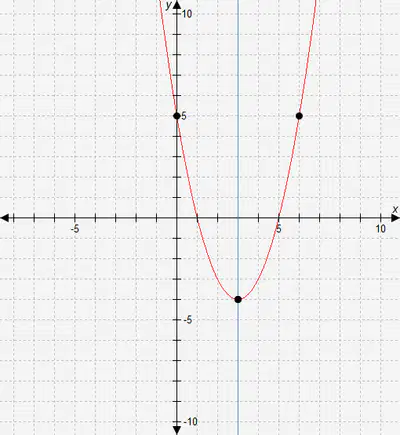
Let’s see what else we can learn by looking at the graph of the function f(x) = (x – 3)2 − 4.
When we draw a vertical line going straight up through the graph’s vertex, (3,-4), we can see that the part of the graph on the left side of this line is mirrored on the right side of the line. This line, x = 3, is called the axis of symmetry for the graph.
Comparing this function with the vertex form, we see that h = 3 and k = -4. So the vertex will be located at (3,-4) and the axis of symmetry will be the line x = 3.
If we observe the point (0,5) on the graph, we can see that this point is 3 units to the left of the line x = 3. Because this line is the axis of symmetry, the point (6,5), which is 3 units to the right of the axis of symmetry at the same y-value of 5, will also be on the graph.
17
Draw
Mark the vertex of the function. Then graph the axis of symmetry and mark the point on the graph that is symmetric to (-3,0).
f(x) = (x − 2)2 − 25
18

The values where the graph of a quadratic function crosses the x-axis, the x-intercepts, are also called zeros of the function. We call them zeros because they represent where the function is equal to 0.
A quadratic function can have up to two zeros. If m is a zero of the quadratic function f, then (x − m) is a factor of function f.
Relating x-intercepts, Zeros, and Factors
19

Let’s explore the relationships between the x-intercepts, zeros, and factors of a quadratic function.
The graph of this quadratic function crosses the x-axis at x = -5 and x = -1. So the x-intercepts of the function are (-5,0) and (-1,0).
Therefore, the zeros of the function are -5 and -1.
Now that we know the zeros, we can build the factors. The factors are written in the form (x − m), when m is a zero of the function. Here, the factors of the function are (x + 5) and (x + 1).
20
Multiple Select
Which two graphs represent a quadratic function with the factors (x − 2) and (x + 3)?
21
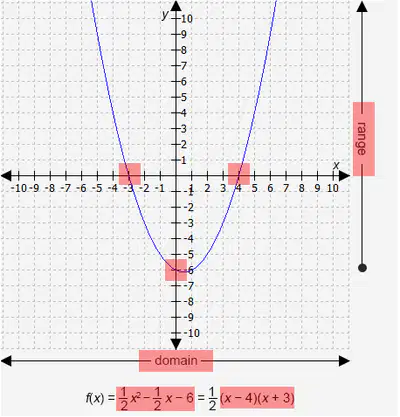
The range is the set of values for which the dependent variable is defined.
If m is a zero of a function, (x − m) is a factor of the function.
The domain is the set of values for which the independent variable is defined.
The point where a parabola crosses the x-axis is an x-intercept. At this point, the value of y is 0. The x-intercepts are also called the zeros of the function.
The y-intercept is at the point where the parabola crosses the y-axis. At this point, the value of x is 0.
22
23
Multiple Select
Which statements are true about the x-intercepts of quadratic functions?
If x = a is an x-intercept of a quadratic function, then (x + a) is a factor of the function.
An x-intercept is located at the point on the function where the value of x is 0.
A quadratic function can have up to two x-intercepts.
All quadratic functions have exactly one x-intercept.
An x-intercept of a quadratic function is also called a zero of the function.
24
Multiple Choice
The zeros of function f are -1 and -5. Which equation could represent function f?
f(x) = (x + 1)(x + 5)
f(x) = (x + 1)(x − 5)
f(x) = (x − 1)(x − 5)
f(x) = (x − 1)(x + 5)
25
Draw
Jason kept track of the number of songs he downloaded each week for 10 consecutive weeks. This function models the number of songs he downloaded, where x is the number of weeks:
N(x) = -3(x − 4)2 + 60.
Plot the axis of symmetry and the vertex for this function.
26
Multiple Choice

Which expressions are factors of the quadratic function represented by this graph?
x and (x + 6)
(x − 6) and (x + 6)
x and -6x
x and (x − 6)
27
Multiple Choice

What point is symmetric to (2,7) on this quadratic graph?
(2,-1)
(-6,7)
(-2,4)
(-5,0)
28
Multiple Choice

Identify the vertex of the function graphed below.
(-1,-4)
(-4,-1)
(-3,0)
(1,0)
29
Multiple Choice

Identify the x-intercepts of the function graphed below.
(-3,0) and (2,0)
(0,0) and (-6,0)
(-2,0) and (3,0)
(-3,0) and (-2,0)
30
Multiple Choice

What is the range of the function represented by this graph?
y ≥ 5
all real numbers
y ≤ 5
y ≥ -6
31
Multiple Choice

Which statement about the following graph is correct?
The graph is symmetric about the line x = -1.
The graph is symmetric about the line x = 1.
The graph is not symmetric.
The graph is symmetric about the line y = -1.
32
Multiple Choice

What is the domain of the function represented by the graph?
x ≥ 4
all real numbers
x ≥ -6
x ≤ -2
A.FGR.7.1, A.FGR.7.3, A.FGR.7.4, A.FGR.7.6
In this lesson, you will recognize, describe, and identify key attributes of quadratic relationships using graphs, equations, or descriptions of the functions.
Show answer
Auto Play
Slide 1 / 32
SLIDE
Similar Resources on Wayground

26 questions
Caracteristiques de les funcions
Presentation
•
8th Grade
25 questions
Symmetry & Triangle Congruence Review
Presentation
•
9th - 10th Grade
25 questions
AP de Matemática: SIMULADO CCB
Presentation
•
12th Grade
23 questions
Plastic Pollution Awareness
Presentation
•
KG - 12th Grade
23 questions
3. Truth Tables
Presentation
•
12th Grade
28 questions
5.3 Trigonometric Ratios
Presentation
•
12th Grade
26 questions
Sample Means
Presentation
•
12th Grade
24 questions
Solving One-Step Equations
Presentation
•
University
Popular Resources on Wayground
10 questions
How much do you know about our Portrait of an Eagle?

Quiz
•
10th Grade
10 questions
Fast Food Slogans
Quiz
•
6th - 8th Grade
21 questions
Continents and Oceans
Quiz
•
6th Grade
20 questions
Parts of Speech
Quiz
•
5th Grade
16 questions
Subject & Predicate
Quiz
•
5th Grade
25 questions
Multiplication Facts
Quiz
•
5th Grade
12 questions
Map Skills
Quiz
•
3rd Grade
22 questions
Continents and Oceans
Quiz
•
5th Grade
Discover more resources for Mathematics
10 questions
Identifying equations
Quiz
•
KG - University
12 questions
Identify Rigid Transformations
Quiz
•
8th - 12th Grade
15 questions
2.3 (b) Domain & Range Lesson Check
Quiz
•
9th - 12th Grade
20 questions
Classifying Real Numbers
Quiz
•
6th - 12th Grade
31 questions
Unit 2 Test Review
Quiz
•
9th - 12th Grade
14 questions
Independent vs Dependent Variable
Quiz
•
9th - 12th Grade
21 questions
Arithmetic Sequences
Quiz
•
9th - 12th Grade
20 questions
Literal Equations
Quiz
•
9th - 12th Grade