Search Header Logo
6A Domain & Range of Quadratic Functions

6A Domain & Range of Quadratic Functions

Assessment

Presentation

Mathematics

9th Grade

Practice Problem

Medium

CCSS
6.NS.B.3, HSF-IF.C.7A, 8.F.A.1

+1

Standards-aligned

Created by

Candace Warr

Used 23+ times

FREE Resource

6 Slides • 10 Questions

1

media
media

​6A: determine the domain and range of quadratic functions and represent the domain and range using inequalities

DOMAIN: all possible x-values; LEFT (least) to RIGHT (greatest)
RANGE: all possible y-values; BOTTOM (least) to TOP (greatest)

2

3

media

Domain: -∞ < x < ∞ , or all real numbers

Range: y ≥ 4, or all real numbers greater than or equal to 4

4

media

5

media
media

​INEQUALITY Symbols
< means LESS than
> means GREATER than
≤ means LESS than or EQUAL to
≥ means GREATER than or EQUAL to

INFINITY
-∞ negative infinity
∞ positive infinity

6

Multiple Choice

Which graph best represents a quadratic function with a range of all real numbers greater than or equal to 3?

1
2
3
4
5

7

Multiple Choice

Question image

The graph of quadratic function f is shown on the grid.

Which of these best represents the domain of f?

1

-3 ≤ x ≤ 2

2

all real numbers

3

y ≥ -5.5

4

All real numbers less than -3 or greater than 2

8

Drag and Drop

Question image
A quadratic function is graphed on the grid.

The domain of the function is ​
.

The range of the function is ​
.
Drag these tiles and drop them in the correct blank above
all real numbers
y ≥ 5
y > 5
x ≥ -3
x > -3
x < -3
x ≤ -3
y ≤ 5
y < 5

9

Multiple Choice

Which graph represents a function with a range of all real numbers greater than or equal to -6?

1
2
3
4

10

Multiple Choice

Question image

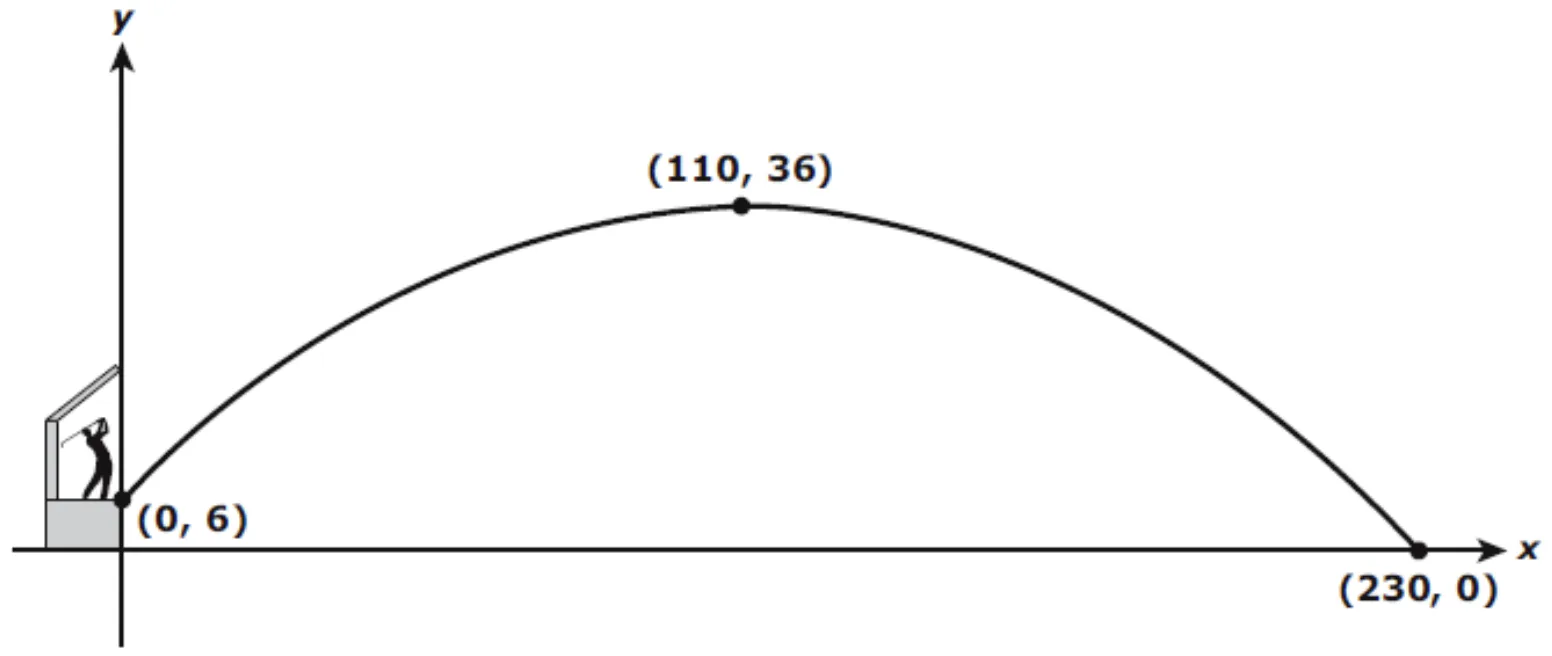
A golfer hit a golf ball from a tee box that is 6 yards above the ground. The graph shows the height in yards of the golf ball above the ground as a quadratic function of x, the horizontal distance in yards of the golf ball from the tee box.

What is the domain of the function for this situation?

1

0 ≤ x ≤ 230

2

6 ≤ x ≤ 230

3

0 ≤ y ≤ 230

4

6 ≤ y ≤ 36

11

Drag and Drop

Question image
The graph of function f is shown on the grid.

The domain of f is ​
.

The range of f is ​
.
Drag these tiles and drop them in the correct blank above
all real numbers
all real numbers less than or equal to 0
all real numbers greater than or equal to 0
all real numbers greater than or equal to -3
all real numbers less than or equal to -3

12

Multiple Choice

Question image

The graph of quadratic function f is shown on the grid.

Which of these best represents the range of f?

1

y ≥ -5.5

2

y > -5.5

3

y < -5.5

4

y ≤ -5.5

13

media

​When part of a function is graphed showing dots instead of arrows, use inequalities to represent domain and range accordingly:

OPEN dot:
<
>

CLOSED dot:

​DOMAIN:
-3 < x ≤ 2
All real numbers greater than -3 and less than or equal to 2

​RANGE:
3 ≤ y < 12
All real numbers greater than or equal to 3 and less than 12

media

DOMAIN:
x < 2
All real numbers less than 2

RANGE:
y ≤ 4
All real numbers less than or equal to 4

14

Multiple Choice

Question image

Part of a quadratic function is graphed on the grid.

Which answer choice best represents the domain and range of the function?

1

Domain: x > 1

Range: y ≤ 9

2

Domain: x < 1

Range: y ≥ 9

3

Domain: x ≥ 1

Range: y ≤ 9

4

Domain: x ≥ 1

Range: y < 9

5

Domain: x > 1

Range: y < 9

15

Multiple Choice

Which graph best represents part of a quadratic function with a domain of all real numbers less than -4?

1
2
3
4

16

Multiple Choice

Which graph represents a domain of all real numbers greater than or equal to -7 and less than 2?

1
2
3
4
media
media

​6A: determine the domain and range of quadratic functions and represent the domain and range using inequalities

DOMAIN: all possible x-values; LEFT (least) to RIGHT (greatest)
RANGE: all possible y-values; BOTTOM (least) to TOP (greatest)

Show answer

Auto Play

Slide 1 / 16

SLIDE