Search Header Logo
Scatterplots Practice

Scatterplots Practice

Assessment

Presentation

•

Mathematics

•

8th Grade

•

Hard

•
8.11.A, CCSS.HSS.ID.B.5, CCSS.6.NS.B.3

+9

Standards-aligned

Created by

PMMS Mustangs

FREE Resource

7 Slides • 55 Questions

1

Scatterplots

media

2

Types of Data

  • Categorical (Qualitative) Data: eye color, favorite subject, zip code, favorite animal

  • Numerical (Quantitative) Data: Height, weight, number of students in a class

  • To determine if data is categorical or numerical, ask if a meaningful average exists.

3

Scatterplots

  • Only for numerical/quantitative data

media

4

Independent variable (x) vs. Dependent variable (y)

  • Think of it in terms of cause and effect: the independent variable (x) causes the dependent variable (y)

  • y "depends" on x

  • The dependent variable is always graphed on the vertical y-axis and the independent variable is always graphed on the horizontal x-axis

5

Multiple Choice

Carey and Justin are raising money to purchase books for the library. The more money they raise, the more books they will be able to purchase for the library.


Which of the variables is dependent?

1

amount of money raised

2

number of books

6

Multiple Choice

The higher the temperature of water, the faster the egg will cook. Select the independent variable.

1

Faster Egg Cooks

2

Higher Temperature

7

Multiple Choice

Molly investigated if the age of students caused them to be better drivers. What is the independent variable?

1

Type of car

2

Skill of driving

3

Age of student

8

media

9

Multiple Choice

Question image
What type of association does this graph have?
1
positive 
2
negative
3
none
4
all of the above

10

Multiple Choice

Question image
Which best describes the form of this scatterplot?
1
linear
2
nonlinear
3
scattered

11

Multiple Choice

Question image
What type of association does this graph have?
1
positive
2
negative
3
none
4
all of the above

12

Multiple Choice

Question image
What type of association does this scatter plot represent?
1
positive linear association
2
negative linear association
3
no association
4
nonlinear association

13

Outliers

  • Extreme values that are either very large or very small with respect to the rest of the data points

media

14

media

15

Dropdown

Question image
What type of correlation does this scatterplot show?​ ​

16

Dropdown

Question image
What type of correlation does this scatterplot show?​

17

Dropdown

Question image
What can you say about this relationship?​

As age ​
study time ​

18

Dropdown

Question image
What type of association does this scatterplot show? ​ ​

19

Dropdown

Question image
What type of correlation does this scatterplot show? ​ ​ ​ ​

20

Dropdown

Question image
What can you say about this relationship? ​As your age ​
daily family time ​
.

21

Dropdown

Question image
This scatterplot shows a ​
association.

22

Dropdown

Question image
This scatterplot shows a ​
correlation.

23

Dropdown

Question image
What can you say about this relationship? As daily T.V. time ​
grades ​
.

24

Dropdown

Question image
This scatterplot shows a ​
association.

25

Dropdown

Question image
This scatterplot shows a ​
correlation.

26

Dropdown

Question image
What can you say about this relationship? As the minutes ​
the gallons in tank ​
.

27

Dropdown

Question image
This scatterplot shows a ​
association.

28

Dropdown

Question image
This scatterplot shows a
correlation.

29

Dropdown

Question image
What can you say about this relationship? As the number of hours ​
the inches of snow ​
.

30

Dropdown

Question image
This scatterplot shows ​
association.

31

Dropdown

Question image
This scatterplot shows ​
correlation.

32

Dropdown

Question image
What can you say about this relationship? There is ​
relationship between your age and the first letter of your last name.

33

Multiple Choice

Question image
What type of relationship does this graph have?
1
Positive 
2
Negative
3
No Relationship
4
Constant

34

Multiple Choice

Question image
What type of relationship does this scatter plot show?
1
Positive
2
Negative
3
No Relationship
4
Constant

35

Multiple Choice

Question image
Which scatter plot show a positive relationship?
1
Graph A
2
Graph B
3
Graph C
4
Graph D

36

Multiple Choice

Question image
Which scatter plot shows no relationship?
1
Graph A
2
Graph B
3
Graph C
4
Graph D

37

Multiple Choice

Question image
Which scatter plot shows a negative relationship?
1
Graph A
2
Graph B
3
Graph C
4
Graph D

38

Multiple Choice

Question image
Which scatter plot shows no relationship?
1
Graph A
2
Graph B
3
Graph C
4
Graph D

39

Multiple Choice

Question image
Based on the scatterplot, which of the following conclusions about the relationship between her height and weight is true? 
1
There is a negative relationship between height and weight
2
There is a positive relationship between height and weight
3
There is a constant relationship between height and weight
4
There is no relationship between height and weight

40

Multiple Choice

Question image
Which statement best represents this relationship?
1
There is no relationship between the number of miles driven and the amount of gas remaining in the tank
2
As the number of miles driven increases, the amount of gas remaining in the tank increases.
3
As the number of miles driven increases, the amount of gas remaining in the tank decreases.
4
A relationship cannot be determined from this scatter plot

41

Multiple Choice

Question image
In the scatter plot, does the image shows a "Line of Best Fit"?
1
Yes
2
No

42

Multiple Choice

Question image
In the scatter plot, does the image shows a "Line of Best Fit"?
1
Yes
2
No

43

Multiple Choice

Question image
In the scatter plot, does the image shows a "Line of Best Fit"?
1
Yes
2
No

44

Multiple Choice

Question image
In the scatter plot, does the image shows a "Line of Best Fit"?
1
Yes
2
No

45

Multiple Choice

Question image
In the scatter plot, does the image shows a "Line of Best Fit"?
1
Yes
2
No

46

Multiple Choice

Question image
Which statement best describes the relationship shown in this scatter plot?
1
Students with a bigger shoe size earn a higher math score
2
Students with a smaller show size earn a higher math score
3
A student's shoe size has no effect on their math score
4
A student with a shoe size of 8 will always earn a score of 80%

47

Multiple Choice

Question image
Based on the scatter plot, which statement best describes the trend?
1
As the daily temperature increases, the number of beach visitors increases.
2
as the daily temperature decreases, the number of beach visitors increases.
3
As the daily temperature increases, there is no change in the number of beach visitors
4
As the daily temperature increases, the number of beach visitors decreases

48

Multiple Choice

Question image
What type of association does this scatter plot show?
1
positive linear association
2
negative linear association
3
no association
4
nonlinear association

49

Multiple Choice

Question image
What type of association does this scatter plot represent?
1
positive linear association
2
negative association
3
no association
4
nonlinear association

50

Multiple Choice

Question image

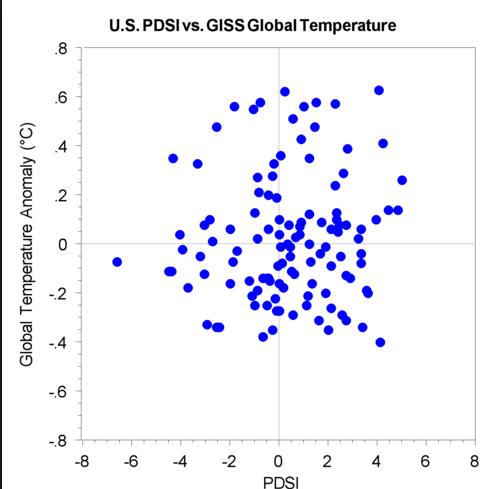
Pick the best description of the association

1

Positive linear weak association with clusters

2

Positive linear strong association

3

Negative non linear weak association

4

positive non linear association

51

Multiple Choice

Question image
What is the strength of this scatter plot? 
1
moderate-strong
2
weak-moderate
3
strong

52

Multiple Choice

Question image

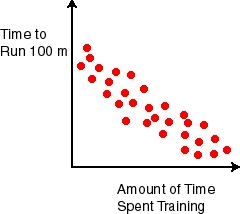
What best describes this association?

1

positive non linear weak

2

positive linear strong

3

negative moderate non linear

4

no association

53

Multiple Choice

Question image

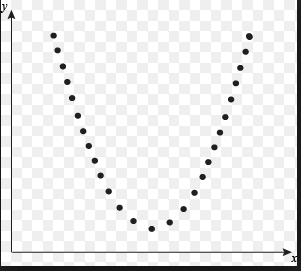
how would you describe this association?

1

positive linear strong

2

positive linear weak

3

positive linear moderate

4

no association

54

Multiple Choice

Question image

How would you describe the association?

1

negative linear strong with outlier

2

negative non linear weak

3

positive linear moderate with outlier

4

outlier

55

Multiple Choice

Question image

describe the association

1

Positive linear weak

2

positive linear strong

3

Positive non linear strong

4

positive linear moderate

56

Multiple Choice

Question image

The scatterplot shows the number of people in each of 8 different households and the average amount of money each household spent on groceries.


Based on the scatterplot, what is the best prediction of the average amount of money spent on groceries for a household that has 7 people?

1

$240

2

$190

3

$210

4

$285

57

Multiple Choice

Question image

Ben collected data from a group of 12 people. He measured each person's resting heart rate and recorded the average number of hours each person exercised per week. He created a scatterplot to show the data he collected.


Based on the scatterplot, what is the best prediction of the resting heart rate, in beats per minute, of a person who exercises an average of 8 hours per week?

1

30 beats per minute

2

50 beats per minute

3

58 beats per minute

4

40 beats per minute

58

Multiple Choice

Question image

The scatterplot shows the average number of hours each of 13 people spends at work every week and the average number of hours each of them spends on recreational activities every week.


Based on the scatterplot, what is the best prediction of the average number of hours a person spends at work every week if that person spends an average of 10 hours on recreational activities each week?

1

34 h

2

78 h

3

55 h

4

65 h

59

Multiple Choice

Question image

The manager of a restaurant recorded how many people were in different groups of customers and how much those groups spent on food and beverages. The scatterplot below shows the data she recorded.


Based on this scatterplot, about how much money would a group of 10 people be expected to spend on food and beverages at this restaurant?

1

$135

2

$119

3

$105

4

$147

60

Multiple Choice

Question image

Mrs. Collins made a scatterplot to show the relationship between the number of absences a student in her class has and the student's final exam score.


Based on this scatterplot, approximately what score should a student with 6 absences expect to receive on the final exam?

1

67

2

86

3

11

4

76

61

Multiple Choice

Question image

Students recorded the total number of pages and chapters in each of several books on the scatterplot.


Based on the scatterplot, which is the best prediction of the total number of pages in a book with 4 chapters?

1

150 pages

2

141 pages

3

89 pages

4

118 pages

62

Multiple Choice

A math teacher observed that as the number of hours students studied their multiplication facts increased, the number of errors the students made on their multiplication tests decreased. Which scatterplot could support this teacher's observation?

1
2
3
4

Scatterplots

media

Show answer

Auto Play

Slide 1 / 62

SLIDE