
Unit 8 Probability and Statistical Reasoning
Presentation
•
Mathematics
•
8th Grade
•
Hard
+12
Standards-aligned
Rabah Issa
FREE Resource
10 Slides • 48 Questions
1
simple probability
What are the odds?
2
3
4
5
Match
Match the following
Independent
Dependent
Probability
When you replace the item
When you DO NOT replace the item
The chance of something happening
When you replace the item
When you DO NOT replace the item
The chance of something happening
6
Multiple Choice
4 yellow, 6 orange, 3 green, 5 blue, 2 brown
What is the probability of selecting a brown candy?
2/18
1/9
2/20
1/10
7
Multiple Choice
2/7
5/49
5/7
10/49
8
Multiple Choice
16 2/3%
33 1/3%
50%
75%
9
Multiple Choice
8/121
4/11
2/11
4/121
10
Multiple Choice
0%
1/6, 16.7%
1/2, 50%
6/6 100%
11
Multiple Choice
0%
1/4, 25%
1/2, 50%`
100%
12
Multiple Choice
1/6, 16.7%
5/6, 83.3%
1/5, 20%
100%
13
Multiple Choice
*Remember to simplify.*
6/8
3/4
2/8
1/4
14
Multiple Choice
on green than yellow?
more likely
less likely
15
Multiple Choice
imposssible
certain
16
Multiple Choice
1/6
7/6
0
7/7
17
Multiple Choice
a fraction
a decimal
a percent
all of the above
18
Multiple Choice
1/4
1/2
2/5
1
19
Multiple Choice
You pick a marble from this bag. What is the probability you will choose either a solid black or solid white marble?
3/5
9/100
1/10
2/5
20
Multiple Choice
5/11
5/6
1/3
5
21
Multiple Choice
3/10
1/3
1/9
3/8
22
Scatterplots
23
Multiple Choice
24
Multiple Choice
25
Multiple Choice
26
Multiple Choice
27
Multiple Choice
28
Multiple Choice
29
Multiple Choice
30
Multiple Choice
Ben collected data from a group of 12 people. He measured each person's resting heart rate and recorded the average number of hours each person exercised per week. He created a scatterplot to show the data he collected.
Based on the scatterplot, what is the best prediction of the resting heart rate, in beats per minute, of a person who exercises an average of 8 hours per week?
30 beats per minute
50 beats per minute
58 beats per minute
40 beats per minute
31
Multiple Choice
Mrs. Collins made a scatterplot to show the relationship between the number of absences a student in her class has and the student's final exam score.
Based on this scatterplot, approximately what score should a student with 6 absences expect to receive on the final exam?
67
86
11
76
32
Parts of a Box Plot
Min – Minimum: Smallest number of the Data Set
Q1 – Lower Quartile: The median of the lower half of the data
Q2 – Median: Middle number of the set of data
Q3 – Upper Quartile: The median of the upper half of the data
Max – Maximum: Largest number in the data set
Interquartile Range (IQR): Q3 – Q1
33
34
35
36
Multiple Choice
66
58
60
64
37
Multiple Choice
62
58
66
60
38
Multiple Choice
4
64
60
8
39
Multiple Choice
What is the interquartile range (IQR)?
20
25
30
50
40
Multiple Choice
64
62
66
58
41
Multiple Choice
Add the biggest and smallest numbers.
Place the numbers in order from least to greatest and find the middle.
Find the difference between the maximum and the minimum.
Subtract Q1 from Q3.
42
Multiple Choice
What percentage of the data is between 90 and 140?
25 %
50%
75%
100%
43
Multiple Choice
What percentage of the data is between 40 and 90?
25 %
50%
75%
100%
44
Multiple Choice
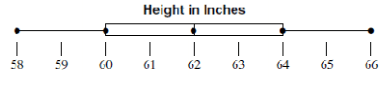
What percent of the data is between 30 and 35 on the number line?
25%
50%
75%
100%
45
Multiple Choice
64
58
66
60
46
Multiple Choice
4
6
2
8
47
Multiple Choice
What percentage of the data is between 90 and 140?
25 %
50%
75%
100%
48
Multiple Choice
What is the median test score on the 6TH Grade Math Test?
78
85
93
97
49
Multiple Choice
A. Stem-and-Leaf Plot
B. Bar Graph
C. Box Plot
D. Pie Chart
50
Multiple Choice
A. Mean, Median, Mode, Range, and Total
B. Lower Extreme, Lower Quartile, Median, Upper Quartile, and Upper Extreme
C. Smallest, Q1, Q2, Q3, and Q4
D. Lower Quartile, Upper Quartile, Range, Mean, and Median
51
Multiple Choice
A. fair share
B. middle
C. repeats the most
D. variation
52
Multiple Choice
A. True
B. False
53
Correlation (Trend)
Positive Correlation (goes up)
Negative Correlation (goes down)
No Correlation (scattered)
54
Multiple Choice
What type of Correlation?
Positive Correlation
Negative Correlation
No Correlation
55
Multiple Choice
What type of correlation?
Positive Correlation
Negative Correlation
No Correlation
56
Multiple Choice
What type of Correlation?
Positive Correlation
Negative Correlation
No Correlation
57
Multiple Choice
58
Multiple Choice
simple probability
What are the odds?
Show answer
Auto Play
Slide 1 / 58
SLIDE
Similar Resources on Wayground
54 questions
Angles and Shapes
Presentation
•
8th Grade
54 questions
L16 Sess 3,4,5
Presentation
•
8th Grade
55 questions
Lesson 11 The Constitution Review
Presentation
•
8th Grade
52 questions
Special Right Triangles and Trigonometry
Presentation
•
8th Grade
54 questions
Nonadjacent Angles
Presentation
•
8th Grade
55 questions
3/7 5th 6 Weeks **Extra Credit**
Presentation
•
8th Grade
49 questions
LESSON: Translating Expressions/Equations/Inequalities
Presentation
•
8th Grade
52 questions
Solving Exponential & Logarithmic Equations Lesson Notes
Presentation
•
9th Grade
Popular Resources on Wayground
20 questions
STAAR Review Quiz #3
Quiz
•
8th Grade
20 questions
Equivalent Fractions
Quiz
•
3rd Grade
6 questions
Marshmallow Farm Quiz
Quiz
•
2nd - 5th Grade
20 questions
Main Idea and Details
Quiz
•
5th Grade
20 questions
Context Clues
Quiz
•
6th Grade
20 questions
Inferences
Quiz
•
4th Grade
19 questions
Classifying Quadrilaterals
Quiz
•
3rd Grade
12 questions
What makes Nebraska's government unique?
Quiz
•
4th - 5th Grade
Discover more resources for Mathematics
15 questions
Pythagorean Theorem Word Problems Quizizz
Quiz
•
8th Grade
20 questions
Graphing Inequalities on a Number Line
Quiz
•
6th - 9th Grade
20 questions
Scatter Plots and Line of Best Fit
Quiz
•
8th Grade
10 questions
Pythagorean Theorem and its Converse
Quiz
•
7th - 9th Grade
20 questions
Pythagorean Theorem Review
Quiz
•
8th Grade
11 questions
8.12D Simple & Compound Interest
Quiz
•
8th Grade
72 questions
8th Grade SS Q3 Study Guide
Quiz
•
8th Grade
20 questions
Function or Not a Function
Quiz
•
8th - 9th Grade