
Functions Review
Presentation
•
Mathematics
•
8th Grade
•
Practice Problem
•
Easy
+7
Standards-aligned

Meghan Kervin
Used 7+ times
FREE Resource
18 Slides • 26 Questions
1
2
3

4
5
Multiple Choice
6
7
Multiple Choice
8
Multiple Choice
9
10

11
Multiple Choice

Is the relation shown in the table a function?
12

13
Multiple Choice

Is the relation shown in the table a function?
14

15
Multiple Choice

Is this table a function or not a function?
16
Multiple Choice

Is this mapping a function or not a function?
17
Multiple Choice

Is this mapping a function or not a function?
18
Multiple Choice
19

20

21
Multiple Choice

Daniel biked to the park. On the way, he stopped for a soda, then continued to the park. After playing a game of catch, Daniel biked home. Between which two points did Daniel more than likely stop for a soda?
22
Multiple Choice

The graph shows Nick's bike ride from home to his grandparents and then returning home. Which intervals show Nick's distance from home increasing?
23
Multiple Choice

I began to walk; then, I increased my pace and held it constant for a period of time and then decreased my pace slowly. Which graph models this situation?
24
Poll
25

26

27

28

29

30

31

32
Multiple Choice

Linear or Nonlinear?
33
Multiple Choice

Linear or Nonlinear?
34
Multiple Choice

Linear or Nonlinear?
35
Multiple Choice
36
Multiple Choice
37
Multiple Choice

Linear or Nonlinear?
38
Multiple Choice
39
Multiple Choice
40
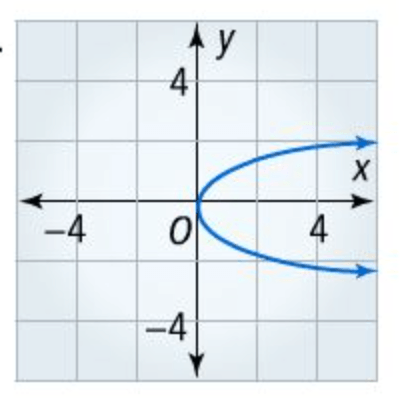
Multiple Choice

Is the graph pictured a linear or nonlinear function?
41
Multiple Choice

The table represents a function. Is it linear or non-linear?
42
Multiple Choice
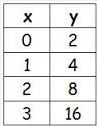
Is the table linear or nonlinear?
43
Poll

Pick the one that speaks to your soul.
44
Multiple Select
Show answer
Auto Play
Slide 1 / 44
SLIDE
