Search Header Logo
  1. Resource Library
  2. Math
  3. Probability And Statistics
  4. Curve Of Best Fit
  5. Curve Of Best Fit
Curve of Best Fit

Curve of Best Fit

Assessment

Presentation

Mathematics

9th Grade

Practice Problem

Medium

CCSS
6.NS.B.3, HSF.BF.A.2

Standards-aligned

Created by

Jessica C. Clervoi

Used 13+ times

FREE Resource

3 Slides • 14 Questions

1

Curve of Best Fit

curve the best approximates the trend on a scatter plot. If the data appears to be quadratic, we perform a quadratic regression to get the equation for the curve of best fit.

media

2

Regression in Desmos

  • Click the plus sign in the top left corner

  • Add item, table and enter data

  • In next row, enter equation of reference

  • Add a squiggle ~ in place of the equal

  • Use the residuals (plot) to get the coefficients for the equation

media

3

4

Multiple Choice

Question image

Find the best fitting quadratic model for the data given.

1

y = 1.2x2 + 13x + 504.3

2

y = 12x2 + 13x + 504.3

3

y = .12x2 + 1.3x + 504.3

5

Multiple Choice

Question image

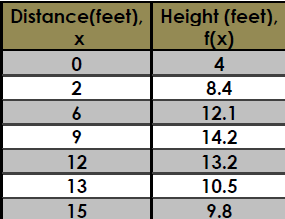
Using the quadratic curve of best fit, find the height of the ball when it traveled a distance of 10 feet.

1

12.8 ft

2

13.3 ft

3

11.1 ft

4

17 ft

6

Multiple Choice

Question image

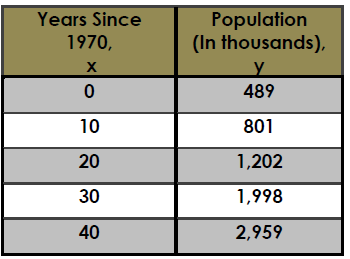
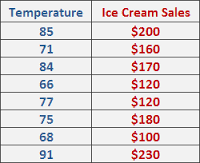
Calculate the Curve of Best Fit for this table of values:

1

y = 2x2 - 9x + 10

2

y = 3x2 + 9x - 10

3

y = 3.1x2 - 9.2x - 10.3

4

y = 2.1x2 - 8.6x + 10.1

7

Multiple Choice

What would the equation be that best fits this data?:


{(-15, 53.5), (-14, 28), (-3, 18), (0, 4), (6, 27), (14, 50)}

1

y = .17x2+.45x+12.43

2

y = .16x2+.45x+12.42

3

y = -.04x + 30

4

y = -.03x + 30

8

Multiple Choice

Question image
The table shows the average braking distance of a car at various speeds.  Use a quadratic model to predict the breaking distance at 70mph.  
1
245 ft
2
225 ft
3
285 ft
4
265 ft

9

Multiple Choice

Question image

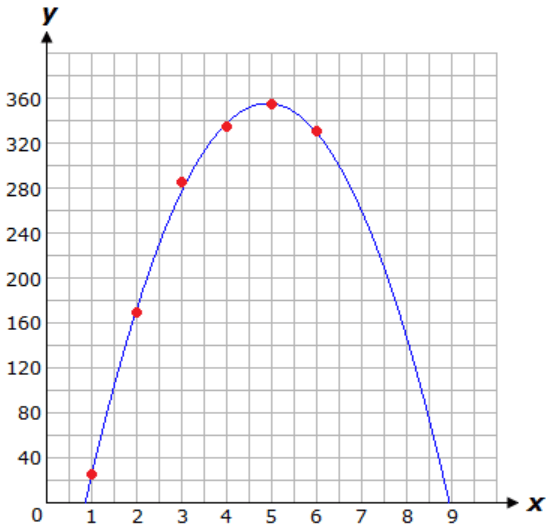
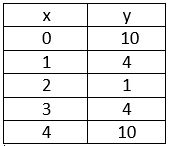
Using the curve of best fit, what would be the output (y) when the input (x) is 7?

1

260

2

240

3

140

4

320

10

Multiple Choice

When using Desmos to find the curve of best fit, what do I need to enter first?

1

y1 ~ ax12 +bx1 + c

2

the equation

3

the table/chart of values

4

the vertex

11

Multiple Choice

When finding the curve of best fit in Desmos, what do I do after I entered my table of coordinates?

1

plot the points

2

y1 ~ ax1 +b

3

y1 ~ ax12 +bx1 + c

4

do a little dance

12

Multiple Choice

Question image

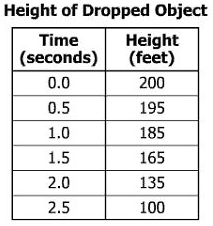
A scientist dropped an object from a height of 200 feet. She recorded the height of the object in 0.5-second intervals. Her data is shown.

Based on a quadratic model, which best approximates the height at 3 seconds?

1

52 feet

2

55 feet

3

65 feet

4

80 feet

13

Multiple Choice

Question image

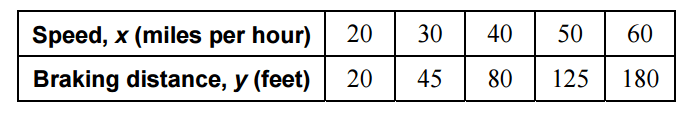
Find the equation of the line of best fit for the given data

1

y = 163.41x+1.49

2

y =- 163.41x+ 4.19

3

y =- 4.19x+163.41

4

y = 4.19x -163.41

14

Multiple Choice

Question image
The scatter plot shows the relationship between the number of chapters and the total number of pages for several books.  Use the trend line to predict how many chapters would be in a book with 180 pages. 
1
12 chapters
2
15 chapters
3
18 chapters
4
21 chapters

15

Multiple Choice

Question image
If Joe worked 30 hours, how much is he expected to earn?
1
$600
2
$200
3
$1000
4
$800

16

Multiple Choice

Question image

What equation best represents this data set?

{(−4, −5), (−3, −8), (−2, −9), (−1, −8), (0, −5), (1, 0.5)}

1

y=1.04x +4.84y=1.04x\ +4.84

2

y=1.04x4.84y=1.04x-4.84

3

y=1.04x2+4.21x4.84y=1.04x^2+4.21x-4.84

4

y=1.04x2+4.21x+4.84y=1.04x^2+4.21x+4.84

17

Multiple Choice

Question image

Based on this pattern, would a Linear or Quadratic model be most appropriate?

1

Quadratic

2

Linear

Curve of Best Fit

curve the best approximates the trend on a scatter plot. If the data appears to be quadratic, we perform a quadratic regression to get the equation for the curve of best fit.

media

Show answer

Auto Play

Slide 1 / 17

SLIDE