
Graphing Functions, Algebra 1 STAAR Prep
Presentation
•
Mathematics
•
9th Grade
•
Hard
+6
Standards-aligned
Margaret M Wilson
Used 7+ times
FREE Resource
9 Slides • 27 Questions
1
Graphing & Identifying Key Features of Linear, Quadratic,
& Exponential Functions + Systems & Inequalities
Using the TI-NSpire Calculator
2
3
Slope of Graphs:
TEKS A.3A:
Determine the slope of a line given a table of values, a graph, two points on the line, and an equation written in various forms, including y = mx + b, Ax + By = C, and y - y1 = m(x - x1).
4
Multiple Choice
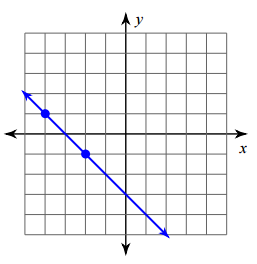
What is the slope of the line?
Zero
Undefined
1
-1
5
Multiple Choice
6
Multiple Choice
Find the slope, m, of the line.
m = runrise
7
Multiple Choice
Find the slope, m, of the line.
m = runrise
8
Linear Functions:
TEKS A.3C:
Graph linear functions and identify key features, including x-intercept, y-intercept, zeros, and slope, in mathematical and real-world problems.
9
Multiple Choice
Linear function t has an x-intercept of -1 and a y-intercept of 5.
Which graph best represents t?
10
Multiple Choice
Which graph best represents y = -4(x + 3) - 2?
11
Multiple Choice
Which graph best represents -5y = -6x + 15?
Calc. Hack: Type nsolve(-5y = -6x + 15, y) in the graphing feature and choose the matching graph.
12
Multiple Choice
Linear function k has a zero of -2 and a y-intercept of 6. Which graph best represents k?
13
Multiple Choice
The graph of linear function k passes through the points (-7, 0) and (1, 8).
Which statement must be true?
The slope of the graph of k is −34 .
The graph of k passes through the point (-1, -8).
The zero of k is 7.
The x-intercept of the graph of k is -7.
14
Quadratic Functions:
TEKS A.7A:
Graph quadratic functions and use the graph to identify key attributes, if possible, including x-intercept, y-intercept, zeros, maximum value, minimum values, vertex, and the equation of the axis of symmetry.
15
Multiple Choice
Two characteristics of quadratic function p are given.
1) The axis of symmetry of the graph of p is x = -3.
2) Function p has exactly one zero.
Based on this information, which graph could represent p?
16
Fill in the Blank
17
Multiple Choice
The graph of a quadratic function is shown on the grid.
Which coordinates best represent the vertex of the graph?
(2.4, 0)
(0, -1)
(-0.4, 0)
(1, -2)
18
Multiple Choice
A graph of f(x)=6x2−11x+3 is shown on the grid.
What are the zeros of f?
3
2 and 9
1211
31 and 23
19
Multiple Choice
Which graph best represents f(x) = x2 - 2x - 3
20
Multiple Choice
Which graph best represents y=−x2+6x−1 ?
21
Exponential Functions:
TEKS A.9D:
Graph exponential functions that model growth and decay and identify key features, including y-intercept and asymptote, in mathematical and real-world problems.
22
Fill in the Blank
23
Multiple Choice
The graph of an exponential function is shown on the grid. Which dashed line is an asymptote for the graph?
Line q
Line r
Line s
Line t
24
Multiple Choice
Which graph best represents f(x)=2(5)x ?
25
Multiple Choice
Which graph best represents y=10(0.85)x ?
26
Systems of Equations:
TEKS A.3F
Graph systems of two linear equations in two variables on the coordinate plane and determine the solutions if they exist.
27
Multiple Choice
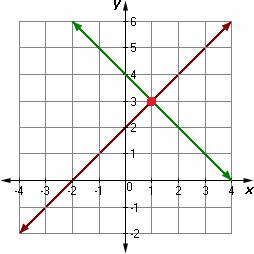
Which system is shown on the graph?
x - y = 4
x + y = 2
x + y = 4
2x - 2y = 1
x + y = -4
x - y = 2
x + y = 4
x - y = -2
28
Multiple Choice
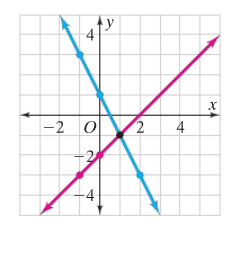
Which system is best represented by the graph?
1.) In the graphing function, type nsolve(2x + y = 1, y) and Enter. Repeat with the other equation(s). Find the matching graphs.
2.) OR plug in the point into the equations and choose the answer with 2 Trues.
2x + y = 1
x - y = 2
x + 2y = 1
x - 2y = 2
2x + 2y = 1
2x - 2y = 2
2x - y = 1
x + y = 2
29
Linear Inequalities:
TEKS A.3D:
Graph the solution set of linear inequalities in two variables on the coordinate plane.
30
Multiple Choice
31
Multiple Choice
32
Multiple Choice
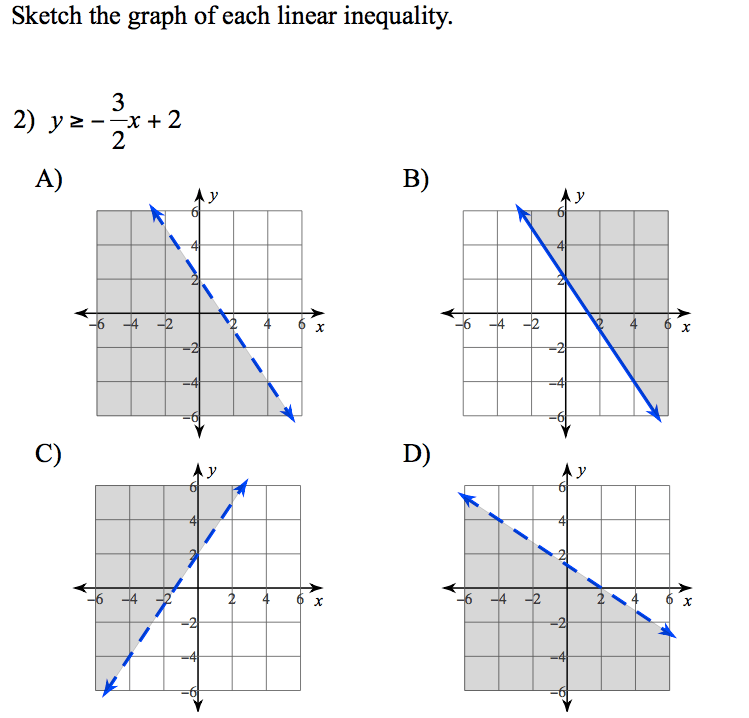
Select the correct graph for each inequality.
Calc. Tip: Change the ≥ to = and graph it.
33
Multiple Choice
34
Systems of Inequalities:
TEKS A.3H:
Graph the solution set of systems of two linear inequalities in two variables on the coordinate plane.
35
Multiple Choice
Solve the system of inequalities by graphing.
36
Multiple Choice
Identify the graph represented by the following system of inequalities.
2x - y > 4
4x + 2y < 6
Graphing & Identifying Key Features of Linear, Quadratic,
& Exponential Functions + Systems & Inequalities
Using the TI-NSpire Calculator
Show answer
Auto Play
Slide 1 / 36
SLIDE
Similar Resources on Wayground
34 questions
Outlier
Presentation
•
9th Grade
29 questions
Scatterplot and line of fit review
Presentation
•
8th Grade
32 questions
Vertex Form
Presentation
•
9th - 10th Grade
30 questions
Introducción al Curso de Computación - Nivel B
Presentation
•
KG
31 questions
Relations vs. Functions
Presentation
•
9th Grade
30 questions
Patterns and Inductive Reasoning
Presentation
•
10th Grade
29 questions
Two Way Frequency Tables
Presentation
•
8th Grade
29 questions
Operations with Scientific Notation
Presentation
•
8th - 10th Grade
Popular Resources on Wayground
10 questions
5.P.1.3 Distance/Time Graphs
Quiz
•
5th Grade
10 questions
Fire Drill
Quiz
•
2nd - 5th Grade
20 questions
Equivalent Fractions
Quiz
•
3rd Grade
22 questions
School Wide Vocab Group 1 Master
Quiz
•
6th - 8th Grade
20 questions
Main Idea and Details
Quiz
•
5th Grade
20 questions
Context Clues
Quiz
•
6th Grade
20 questions
Inferences
Quiz
•
4th Grade
12 questions
What makes Nebraska's government unique?
Quiz
•
4th - 5th Grade
Discover more resources for Mathematics
20 questions
Graphing Inequalities on a Number Line
Quiz
•
6th - 9th Grade
20 questions
Exponential Functions Key Features
Quiz
•
9th Grade
11 questions
Adding and Subtracting Polynomials
Quiz
•
9th Grade
12 questions
Exponential Growth and Decay
Quiz
•
9th Grade
20 questions
Box and Whisker Plots
Quiz
•
9th Grade
25 questions
Complementary and Supplementary Angles
Quiz
•
7th - 10th Grade
15 questions
Graphing Inequalities
Quiz
•
7th - 9th Grade
21 questions
Factoring Trinomials (a=1)
Quiz
•
9th Grade