
Outlier
Presentation
•
Mathematics
•
9th Grade
•
Medium
+5
Standards-aligned

Blake Emerton
Used 60+ times
FREE Resource
12 Slides • 22 Questions
1

2

3
Multiple Choice

A value that is much higher or much lower than the other values in a set of data.
4
Multiple Choice

Identify the outlier for the given data?
23, 34, 27, 7, 30, 26, 28, 31, 34
5

6
Multiple Select
7
Multiple Choice
8

9

10
Multiple Choice

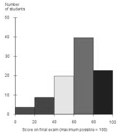
Describe the histogram:
11
Multiple Choice
12
Multiple Choice
13
Multiple Choice
14
Multiple Choice
15
Multiple Choice

16
Multiple Choice

How many vehicles get more than 24 miles per gallon?
17

18

19
Multiple Choice

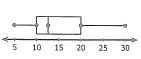
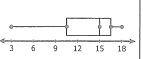
Which group has a greater median shopping time?
20
Multiple Choice

Which club has the smaller spread?
21
Fill in the Blanks

Type answer...
22

23

24

25
Multiple Choice
26

27

28
Multiple Choice
29
Multiple Choice

30
Multiple Choice

31
Multiple Choice

The following scatter plot shows Pamela's training as she prepares to run a 6 mile race at the end of the month. Which of the following would be a reasonable approximation for the length of time it would take for her to run 6 miles?
32
Multiple Choice

Which type of regression model does the scatter plot appear to show?
33
Multiple Choice

Choose the linear equation that best fit the data shown on the graph.
34
Multiple Choice

Show answer
Auto Play
Slide 1 / 34
SLIDE
