
Historical Analysis of Immigration Trends
Presentation
•
Social Studies
•
8th Grade
•
Practice Problem
•
Medium

BROOKE HOFFMAN
Used 67+ times
FREE Resource
4 Slides • 12 Questions
1
Multiple Choice
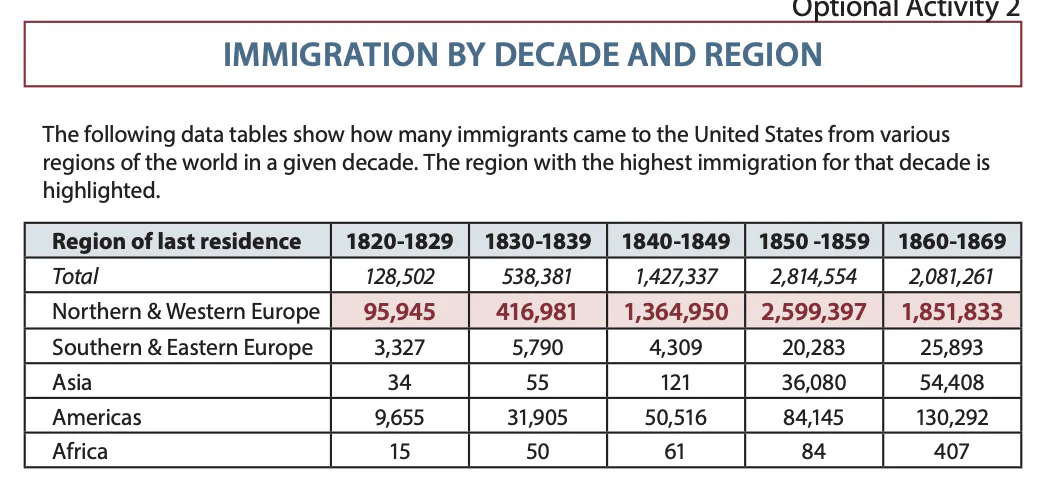
What is the main idea of this chart?
2
Multiple Choice

What does the highlighted boxes show?
3
Open Ended
4
Multiple Select
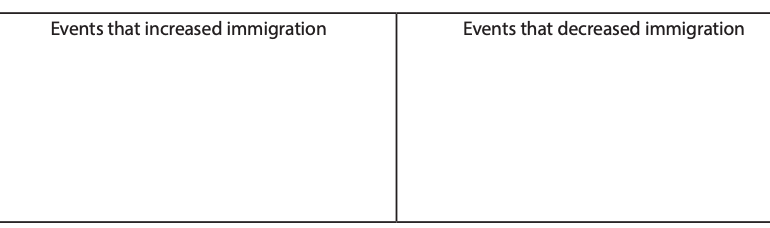
Choose ALL the events that increased immigration.
5
Multiple Select
Choose ALL the events that DECREASED immigration.
6
Multiple Choice
7
Multiple Choice
8

9
Open Ended
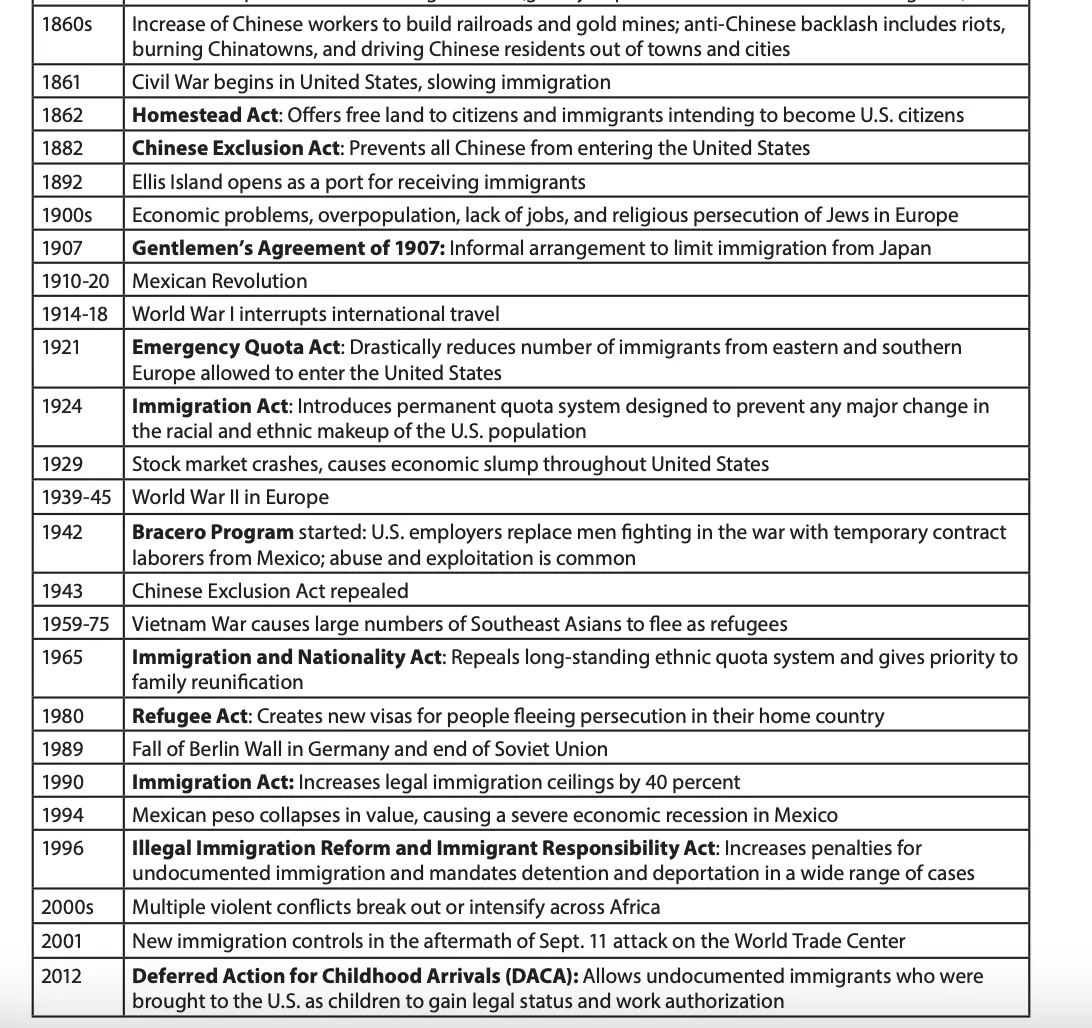
Why do you think immigration to the U.S. decreased so much between 1910 and 1930's?
10
11
12
Open Ended
What events may have caused the huge increase of immigrants coming to the U.S. after 1980?
13
14
Draw
15
Open Ended
16
Poll
What is the main idea of this chart?
Show answer
Auto Play
Slide 1 / 16
MULTIPLE CHOICE
