Search Header Logo
  1. Resource Library
  2. Math
  3. Probability And Statistics
  4. Center And Spread
  5. Eoc Review: Center, Spread, & Variability
EOC Review: Center, Spread, & Variability

EOC Review: Center, Spread, & Variability

Assessment

Presentation

Mathematics

9th - 12th Grade

Medium

CCSS
6.SP.B.5D, 6.NS.B.3, 6.SP.A.3

+7

Standards-aligned

Created by

Amy Warner

Used 5+ times

FREE Resource

3 Slides • 41 Questions

1

media

Median and IQR

Median - the middle value in an ordered data set

Roughly 50% of the data is below and above the median

Measures the typical value for data in a skewed distribution

NOT influenced by all data values

Interquartile Range (IQR) - the middle 50% of the data in a distribution

Found by subtracting the 1st quartile (Q1) from the 3rd quartile (Q3)

Measures the variability of a sample with a skewed distribution

2

Multiple Select

Select the (2) measures of CENTER.

1

Mean

2

Median

3

IQR

4

Standard Deviation

3

Multiple Select

Select the (2) measures of VARIABILITY.

1

Mean

2

Median

3

IQR

4

Standard Deviation

4

media

Appropriate Measures of Center and

Variation

  • The shape of the distribution determines which measure of center
    and variability are best.

  • Use the mean and standard deviation for symmetrical distributions.

  • Use the median and IQR for skewed distributions or distributions that have outliers.

5

Multiple Choice

If there is an Outlier in the set which measure of CENTER would you use?

1

Mean

2

Median

3

IQR

4

Standard Deviation

6

media

Comparing Measures of Center

In a symmetric distribution, the mean and the median are
approximately the same.

In a right skewed distribution the mean tends to be greater than the
median.

In a left skewed distribution the mean tends to be less than the
median.

7

Multiple Choice

If there is an Outlier in the set which measure of VARIABILITY would you use?

1

Mean

2

Median

3

IQR

4

Standard Deviation

8

Multiple Choice

If there is NOT an Outlier in the set which measure of VARIABILITY would you use?

1

Mean

2

Median

3

IQR

4

Standard Deviation

9

Multiple Choice

If there is NOT an Outlier in the set which measure of CENTER would you use?

1

Mean

2

Median

3

IQR

4

Standard Deviation

10

Multiple Select

Which measurements would represent the BEST measures of center & variability for the data set shown?

26, 29, 24, 33, 31, 43, 17, 84, 23, 27, 29

1

Mean

2

Median

3

IQR

4

Standard Deviation

11

Multiple Select

Which measurements would represent the BEST measures of center & variability for the data set shown?

8, 7, 6, 5, 4, 4, 3, 2, 9, 7

1

Mean

2

Median

3

IQR

4

Standard Deviation

12

Multiple Select

Question image

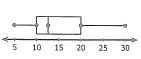
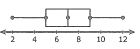
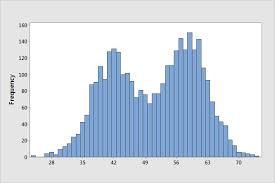
Study the graph and determine one measure of center and one measure of variability that would best describe the data. (hint: are there outliers?)

1

Standard Deviation

2

Median

3

Mean

4

IQR

13

Multiple Choice

Question image
Describe the shape of the distribution.
 
1
Skewed Left
2
Skewed Right
3
Uniform
4
Normal

14

Multiple Choice

Question image
Describe the shape of the distribution.
 
1
Skewed Left
2
Skewed Right
3
Uniform
4
Normal

15

Multiple Choice

Question image
Describe the shape of the distribution.
 
1
Skewed Left
2
Skewed Right
3
Symmetric
4
Uniform

16

Multiple Choice

Question image

Type of Data arrangement

1

Symmetrical

2

Hairline

3

Skewed Right

4

Skewed Left

17

Multiple Choice

Question image

Which of the following best describes the shape of the distribution?

1

SKEWED LEFT

2

SKEWED RIGHT

3

SYMMETRICAL

18

Multiple Choice

A data value that is much higher or much lower than the other values in a data set.
1
outlier
2
inlier
3
immalier
4
sublier

19

Drag and Drop

Question image
This distribution is ​
so we should use the ​
as a measure of center and the ​
as a measure of variability.
Drag these tiles and drop them in the correct blank above
right skewed
median
IQR
fairly symmetric
left skewed
mean
standard deviation
range
mode

20

Drag and Drop

Question image
This distribution is ​
so we should use the ​
as a measure of center and the ​
as a measure of variability.
Drag these tiles and drop them in the correct blank above
fairly symmetric
mean
range
left skewed
mode
median
IQR
right skewed

21

Multiple Choice

Question image

What is the shape of the data?

1

symmetrical

2

skewed left

3

skewed right

4

uniform

22

Multiple Choice

Question image

What is shape of the data?

1

uniform

2

skewed left

3

skewed right

4

symmetrical

23

Multiple Choice

Question image

What is the shape of the distribution?

1

Skewed Left

2

Skewed Right

3

Symmetric

4

Bimodal

24

Multiple Choice

Question image

What is the shape of the data?

1

symmetrical

2

skewed left

3

skewed right

4

uniform

25

Multiple Choice

Question image

Which of the following best describes the shape of the distribution?

1

Skewed left

2

Skewed right

3

uniform

4

symmetrical

26

Multiple Choice

Question image

What is the shape of the data?

1

symmetrical

2

skewed left

3

skewed right

4

uniform

27

Multiple Choice

Question image

Which statement best describes this graph?

1

There is a peak at 47.

2

There is a cluster around 38-40.

3

The mode is 40, 28 and 42

4

There is a gap in the data between 39-40.

28

Multiple Choice

Question image

Where is the gap in the data?

1

17

2

19

3

22

4

26

29

Multiple Choice

The ages of nine employees at a company are shown below.
45, 50, 52, 58, 63, 63, 41, 58, 49
The company hires a tenth employee who is 28 years old. What effect does the new employee have on the shape of the data distribution?
1
The new employee causes the distribution to become skewed to the right.
2
The new employee causes the distribution to be skewed to the left.
3
The new employee causes the distribution to become more symmetrical.
4
The new employee causes the distribution to become less spread out.

30

Multiple Choice

Question image

Which statement best describes this graph?

1

There is a peak at 2.

2

There is a gap in the data.

3

This graph is bimodal.

4

There is no mode.

31

Multiple Choice

Question image

Which statement is INCORRECT?

1

The graph for Lucy's Steakhouse is skewed right

2

The IQR for Gary's Grill is 10.

3

The graph for Gary's Grill is skewed left.

4

The Range for Lucy's Steakhouse is 40.

32

Multiple Choice

Question image

Which statement best describes the graph?

1

The data is skewed left.

2

The data is symmetrical.

3

There is a peak between 10 and 14 hours.

4

There is a cluster between 5 and 9

33

Multiple Choice

Question image

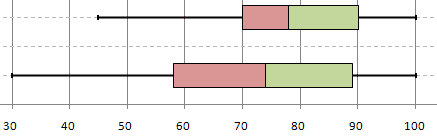
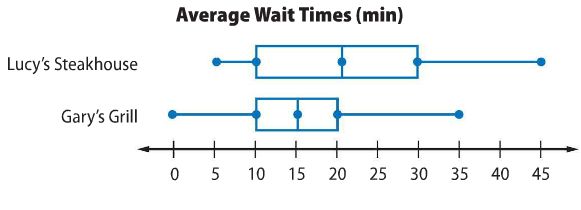
Which box and whisker plot shows more variability?

1

Top plot

2

Bottom plot

34

Multiple Choice

The number of books 11 students read during their summer vacation are shown below.
5, 7, 4, 23, 3, 2, 4, 4, 3, 8, 6
Which statement below is true?
1
The student who read 2 books caused the data distribution to be skewed left.
2
The student who read 2 books caused the data distribution to be skewed right.
3
The student who read 23 books caused the data distribution to be skewed to the left.
4
The student who read 23 books caused the data distribution to be skewed to the right.

35

Multiple Choice

Question image

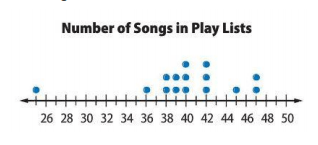
Last year, students at NGMS gathered data on how many pages are in fiction books in their library. Which statement is true about the distribution?

1

The distribution is perfectly symmetrical

2

Most of the books have over 400 pages

3

There is a large cluster of books that have between 150-400 pages.

4

There is a cluster of data between 400 and 1000 pages

36

Multiple Choice

What measure of central tendency (mean, median or mode) would be best for the following set of data?

0, 89, 92, 97, 99, 100

1

Mode, because it is the one that shows up the most.

2

Median, because there is an outlier.

3

Mean, because there is not an outlier.

4

There is not a best measure of central tendency for this data.

37

Multiple Choice

Question image

Describe the peak of the distribution.

1

There is no peak of the distribution.

2

This graph is unimodal.

3

This graph is bimodal.

4

This graph is multimodal.

38

Multiple Choice

Question image

Which of the following is true about the shape and spread of the data distribution in the histogram above?

1

Uniform with a range of 89

2

Uniform with a range of 75

3

Symmetric with a range of 75

4

Symmetric with a range of 84

39

Multiple Choice

Question image

What is the shape of the distribution?

1

Skewed Left

2

Skewed Right

3

Unimodal

4

Bimodal

5

Multimodal

40

Multiple Choice

Question image

Which is a true statement based on the box plots above

1

The data for Team B have the greater range.

2

The data for Team A are more symmetric.

3

The data for Team B have the greater interquartile range.

4

The data for Team A have the greater median.

41

Multiple Choice

Question image

Which is a true statement based on the dot plots above?

1

Set B has the greater range

2

Set B has the greater median

3

Set B is skewed left

4

Set A is less symmetric that Set B

42

Multiple Choice

Question image
Which dot plot has the greatest variability?
1
A
2
B
3
C
4
D

43

Multiple Choice

Question image

What conclusion can Ms. Long make about the performance of her first- and second-period classes?

1

The first-period class had a higher median score than the second-period class.

2

Both graphs are uniform with one peak.

3

The first-period class scores had a greater range than the second-period class scores.

4

Both classes have the same range.

44

Multiple Choice

Question image

Which value(s) are outlier(s) for the age of male Oscar winners?

1

80

2

76

3

60

4

29

media

Median and IQR

Median - the middle value in an ordered data set

Roughly 50% of the data is below and above the median

Measures the typical value for data in a skewed distribution

NOT influenced by all data values

Interquartile Range (IQR) - the middle 50% of the data in a distribution

Found by subtracting the 1st quartile (Q1) from the 3rd quartile (Q3)

Measures the variability of a sample with a skewed distribution

Show answer

Auto Play

Slide 1 / 44

SLIDE