Search Header Logo
  1. Resource Library
  2. Math
  3. Data And Graphing
  4. Graph Analysis
  5. Review Data, Circles, & Circle Graphs
Review- Data, Circles, & Circle Graphs

Review- Data, Circles, & Circle Graphs

Assessment

Presentation

Mathematics

6th Grade

Easy

CCSS
7.G.B.4, 6.SP.B.5D, 6.NS.B.3

+9

Standards-aligned

Created by

Theresa Reedy

Used 2+ times

FREE Resource

7 Slides • 51 Questions

1

media

Parts of a Circle

2

Multiple Choice

Question image
Is the red line a radius or diameter of the circle?
1
Radius
2
Diameter

3

Multiple Choice

Question image
What is the diameter?
1
8
2
16
3
10
4
4

4

Multiple Choice

Question image
What is the radius?
1
18
2
72
3
38
4
14

5

Multiple Choice

Question image
Is the red line a radius or diameter of the circle?
1
Radius
2
Diameter

6

Multiple Choice

Question image
What is the diameter?
1
5 in
2
10 in
3
3.14 in
4
15.84 in

7

Multiple Choice

What does "circumference" mean?
1
Space a circle takes up
2
Distance around a circle
3
Line from one side of a circle to another
4
Line from center of circle to side

8

Multiple Choice

The symbol for Pi is
1
π
2
Σ
3
Ψ
4

9

Multiple Choice

Which formula below would you use to find π?
1
C/d = π
2
C x d= π

10

Multiple Choice

π is equal to circumference divided by _________________.
1
radius
2
diameter
3
area
4
itself

11

Multiple Choice

The diameter of a circular pool is 24.8 feet and the circumference is 77.9 feet. What should you do to find π?

1

77.9 / 24.8

2

24.8 / 77.9

12

media

Finding the Circumference of a circle

media

13

Multiple Choice

If my radius is 10ft, what is my diameter?
1
20ft
2
5ft
3
31.4ft
4
62.8ft

14

Multiple Choice

Question image

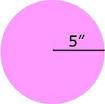
what is the circumference of this circle ?

C= Πd\Pi d

C= 2Πr2\Pi r

1
3.14 cm 
2

37.70 cm

3
24 cm
4
68.4 cm

15

Multiple Choice

A circular swimming pool is 21 feet in diameter.
How many feet around is the pool?

C= Πd\Pi d

C= 2Πr2\Pi r

1
10.5 ft
2
42 ft
3

65.97 ft

4
131.95 ft

16

Multiple Choice

Question image

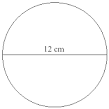
What is the circumference?

C= Πd\Pi d

C= 2Πr2\Pi r

1

50.27

2

96.50

3

24.8

4

18.27

17

Multiple Choice

Question image

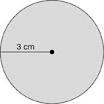
Find the circumference (to the nearest whole number)

C= Πd\Pi d

C= 2Πr2\Pi r

1
88 in
2
44 in
3
116 square in
4
None of the above

18

media

Area of A Circle

19

Multiple Choice

Question image

Find the area of the circle

A= Πr2\Pi r^2

1
43.96
2

153.94

3
87.82
4
307.72

20

Multiple Choice

Question image

find the area of the circle below.

A= Πr2\Pi r^2

1

100.15 cm

2

225.27 cm

3

9.15 cm

4

28.27 cm

21

Multiple Choice

Question image

What is the area of this circle?

A= Πr2\Pi r^2

1
163.2
2
15.3
3
124.2
4
113.1

22

Multiple Choice

Question image

What is the area of this circle?

A= Πr2\Pi r^2

1
15393.8
2
1248.12
3
5930.12
4
3848.45

23

media

Mean, Median, Mode

​Remember..."balance point" = find the mean

24

Multiple Choice

Question image
At Donald's Donuts the number of donut holes in a bag can vary. Help Donald find the mode.
12,10,10,10,13,12,11,13,10
1
13
2
12
3
11
4
10

25

Multiple Choice

Find the mean of these numbers:
2, 57, 38, 42, 6
1
29
2
38
3
50
4
145

26

Multiple Choice

Find the median of these numbers:
4,2,7,4,3
1
2
2
5
3
7
4
4

27

Multiple Choice

Find the median.
12, 5, 9, 18, 22, 25, 5
1
9
2
8
3
12
4
18

28

Multiple Choice

Find the Mean of:
8, 14, 32, 6, 15
1
15
2
175
3
75
4
12

29

Multiple Choice

Find the mode:
5, 0, 9, 9, 3, 0, 5, 5, 4
1
9
2
5
3
3
4
7

30

media

Best Measure of Center

31

Fill in the Blank

32

Multiple Choice

Which measure of center best represents this set of data?
12, 13, 11, 16, 31, 14, 10, 15
1
Mean
2
median
3
mode

33

Multiple Choice

Which measure of center best represents this set of data?
red, blue, red, yellow, red, green, black, red, white, red, red
1
Mean
2
median
3
mode

34

Multiple Choice

The salary of the employees in the office were $15,000; $18,000; $16,000; $14,000; $90,000; and $17,000.  What is the best measure of the central tendency of the salaries?
1
Mean
2
Median
3
Mode
4
Range

35

Multiple Choice

What measure of center is best to use when we have outliers?

1

mean

2

median

3

mode

4

range

36

Multiple Choice

When analyzing numerical data, the best measure of center with NO outlier is:

1

mean

2

median

3

mode

4

range

37

Multiple Choice

Question image
How would you describe this distribution?
1
Left skewed
2
Uniform
3
Right Skewed
4
Symmetrical

38

Multiple Choice

Question image

Which is the best measure of central tendency?

1

Mean because the data is symmetrical and there are no outliers

2

Median because the data has is skewed

3

Mode because there is a peak

4

Median because there are outliers

39

Multiple Choice

Question image

Which is the best measure of center to use for this data?

1

Mean because the data is symmetrical

2

Median because the data is skewed left

3

Mode because the data is skewed left

40

Multiple Choice

Question image

Which is the best measure of center to use for this data?

1

Mean because the data is symmetrical

2

Median because the data is skewed left and there are outliers

3

Mode because the data is skewed left

41

media

Area of a Triangle

42

Multiple Choice

Question image

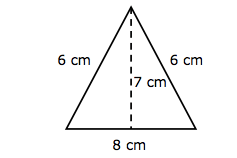
What is the height of this triangle?

A= 12bh    or     bh2\frac{1}{2}bh\ \ \ \ or\ \ \ \ \ \frac{bh}{2}

1

7 cm

2

8 cm

3

28 cm2

4

6 cm

43

Multiple Choice

Question image

Find the area of the triangle

A= 12bh    or     bh2\frac{1}{2}bh\ \ \ \ or\ \ \ \ \ \frac{bh}{2}

1

12 in2

2

12 in2

3

24 in2

4

6 in2

44

Multiple Choice

Question image

Area

A= 12bh    or     bh2\frac{1}{2}bh\ \ \ \ or\ \ \ \ \ \frac{bh}{2}

1

12 inches

2

12 square inches

3

24 square inches

4

6 square inches

45

Multiple Choice

Question image

Find the area?

A= 12bh    or     bh2\frac{1}{2}bh\ \ \ \ or\ \ \ \ \ \frac{bh}{2}

1
15 in²
2
30 in²
3
15 in
4
 30 in

46

Multiple Choice

Question image

What is the area of the triangle shown?

A= 12bh    or     bh2\frac{1}{2}bh\ \ \ \ or\ \ \ \ \ \frac{bh}{2}

1
44.4 mm²
2
8.5 mm²
3
8.88 mm²
4
17.76 mm²

47

media

Circle Graphs

48

Multiple Choice

Question image
The team scored 50 points. How many points did Kendrick score?
1
12 points
2
20 points
3
10 points
4
72 points

49

Multiple Choice

Question image
There are 200 vegetable plants in a garden.  How many of the vegetable plants are green beans?
1
16
2
24
3
28
4
32

50

Multiple Choice

Question image
According to this circle graph, what is the least popular flavor of Jolly Rancher?
1
Blue Rasberry
2
Watermelon
3
Grape
4
Apple

51

Multiple Choice

What is the total percent of a pie or circle graph?
1
10%
2
50%
3
100%
4
1000%

52

Multiple Choice

Question image

Which table represents the data in the graph?

1
2
3
4

53

Multiple Choice

Question image

Which table represents the same data shown in the graph?

1
2
3
4

54

Multiple Choice

Question image

Which circle graph best represents the same set of data as the bar graph?

1
2
3
4

55

Multiple Choice

Question image

Approximately how many hours a day are spent in school and doing homework? (Remember: how many hours are in a day?)

1

6 hours

2

8 hours

3

2 hours

4

12 hours

56

Multiple Choice

Question image

3) Mark made a circle graph of his budget. Which fraction could represent the amount of Mark's budget spent on entertainment?

1
2
3
4

57

Multiple Select

Question image

1) Ben surveyed 40 students about their favorite color. This circle graph shows the results. Identify each pair of colors that together could represent the results of a group of exactly 20 students.

1

Yellow and Green

2

Green and Pink

3

Blue and Green

4

Pink and Blue

5

Red and Green

58

Multiple Choice

Question image

2) 12 students answered a multiple-choice question with answer choices labeled A, B, C, and D. The circle graph represents how the students answered the question. Which of these represents the same data shown in the graph?

1
2
3
4
media

Parts of a Circle

Show answer

Auto Play

Slide 1 / 58

SLIDE