
Alg2 Lesson 1.3
Presentation
•
Mathematics
•
9th - 12th Grade
•
Practice Problem
•
Easy

Monica Ramirez
Used 5+ times
FREE Resource
19 Slides • 6 Questions
1

Lesson 1.3: Evaluating the
Appropriateness of a Linear Model
Obj: I can use residual plots to determine if a
function model fits a data set. I can construct linear
functions.
EQ: How do I find a least-squares linear regression
and use it to make predictions?
2


Roles:
Facilitator
Scribe
Resourcer
Includer
3

Facilitator
• Make sure that all peers are staying on task.
• Give advice or suggestions to resolve the problem.
• Be sure everyone is able to explain.
4

Scribe
• Make sure peers organize their results on their own papers.
• Remind peers to use color, arrows, and other math tools to
communicate your mathematics, reasons, and connections.
• Be ready to join the teacher for a huddle.
5

Resourcer
• Make sure peers are getting the materials needed.
• Make sure that all materials are put away neatly.
• Make sure that peers are logged in to the needed site.
• Help troubleshoot any technology difficulties that may arise.
6

Includer
• Make sure that all peers are talking about their work.
• Helps keep peers’ voice volume low.
• Communicates conflicts or questions to the teacher.
7
Poll
Which role will you play today?
Facilitator
Scribe
Resourcer
Includer
8

Part 1: Understanding Error
and Defining Residuals
9


Which Line is Best?
Stella, Jasmine, and Brani went on a road trip. Every so often, someone
wrote down how long they had traveled, in minutes, and how far they had traveled, in miles. They plotted their data pairs as points on a coordinate grid and each determined a different linear equation to model the data. Which linear equation do you think best fits the data, and why do you think so? Write your reasoning in your journal.
10
Poll
Which linear model do you think fits the data best?
Brani's
Jasmine's
Stella's
11


Definition
A residual is the difference between the actual
y-value and the y-value predicted by the model.
Set up a table like this in your journal. Find the sum of the squares of each residual and divide by the number of terms. Do this for each of the 3 graphs.


12

Part 2: Using Residuals to Minimize
the Error of a Linear Model
13

Minimizing Error
The line of best fit is sometimes referred
to as the least-squares regression line
because it minimizes the squared error
of the function model.
14

Desmos
Explore the Desmos Interactive: preap.org/Desmos-SumSquares
Use the black points to move the black line to find the smallest
value you can for the "Sum of the Squares". Least Squares
Regression works by minimizing the sum of the squared residuals between the actual data and the linear model.
In your journal, answer the following questions:
● Why do you think the residuals are squared?
● What does the square of the residual represent geometrically?
15

Refer back to the 3 Linear Models
Which model has the least sum of
the squared residuals?
Answer this on the next slide.
16
Multiple Choice
Which model has the least sum of
the squared residuals?
Stella's
Jasmine's
Brani's
17
Word Cloud
Type your favorite thing about fall!
18

Part 3: Determining the
Appropriateness of a Linear Model
19


Investigating Residual Plots
Graph the points on Desmos. Plot the “RESIDUALS” Go
to: https://www.desmos.com/calculator/cmg0uudvbn The residuals are all on the x-axis. A linear regression model is appropriate since the residuals are all in a straight line. This means that there is no difference between the actual values and the values predicted by the model.
Model: y = 0.4x + 1.9
r = 1 indicates that it is a
positive strong correlation.
20


Sort Each Residual Plot
(on next slide)
r = 0.9777
r = 0.8732
r = -0.9809
r = 0.9745
21
Categorize


r=0.9777
r=0.8732
r=-0.9809
r=0.9745
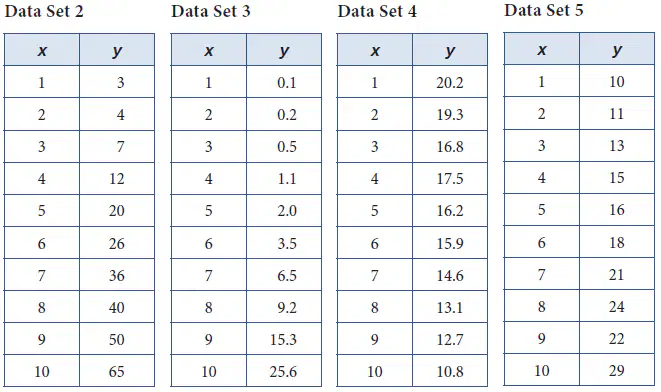
Sort correlation coefficients residual plots for each data set.
22
Open Ended
Summarize the topic from the slides and answer the essential question: How do I find a least-squares linear regression and use it to make predictions?
23


Random Question of the Day Time
https://wheelofnames.com/4ke-epz
We’ll spin the wheel as a class and spend a minute or so discussing our answers.
24

● Go to your calendar paper.
● Select a skill to work on independently or with a partner.
● Work on Unit 1 Deltamath.
Self-Acquisition Time
25


http://preap.org/Desmos-PainRelief
Lesson 1.3: Evaluating the
Appropriateness of a Linear Model
Obj: I can use residual plots to determine if a
function model fits a data set. I can construct linear
functions.
EQ: How do I find a least-squares linear regression
and use it to make predictions?
Show answer
Auto Play
Slide 1 / 25
SLIDE
Similar Resources on Wayground

19 questions
BARISAN DAN DERET GEOMETRI
Presentation
•
9th - 12th Grade
21 questions
Prove Triangle Congruence
Presentation
•
9th - 12th Grade
21 questions
Properties of Exponents
Presentation
•
9th - 12th Grade
21 questions
Exponential & Logarithms Practice
Presentation
•
9th - 12th Grade
17 questions
Factoring Trinomials a = 1 Lesson
Presentation
•
9th - 12th Grade
17 questions
4.2 - Quadratics in Standard Form
Presentation
•
9th - 12th Grade
19 questions
Literal Equations Practice Problems
Presentation
•
9th - 12th Grade
20 questions
Average Rate of Change
Presentation
•
9th - 12th Grade
Popular Resources on Wayground
24 questions
PBIS-HGMS Day 10
Quiz
•
6th - 8th Grade
10 questions
HCS SCI 03 Summer School Review 3
Quiz
•
3rd Grade
11 questions
Home Scope
Quiz
•
7th - 8th Grade
15 questions
HCS SCI 05 Summer School Assessment 3 Review
Quiz
•
5th Grade
35 questions
Lufkin Road Middle School Student Handbook & Policies Assessment
Quiz
•
7th Grade
18 questions
Geo 11.3 Area of Circles and Sectors
Quiz
•
9th - 11th Grade