
1.3 Graphing
Presentation
•
Science
•
9th - 12th Grade
•
Medium
•
NGSS
MS-ESS1-2, MS-PS3-1, MS-ESS2-1
+12
Standards-aligned

Matthew Koch
Used 7+ times
FREE Resource
35 Slides • 5 Questions
1

2

3

4

5

6

7

8

9

10

11

12

13

14

15

16

17

18

19

20

21

22

23

24

25

26

27

28

29

30

31

32

33

34

35

36
Multiple Choice
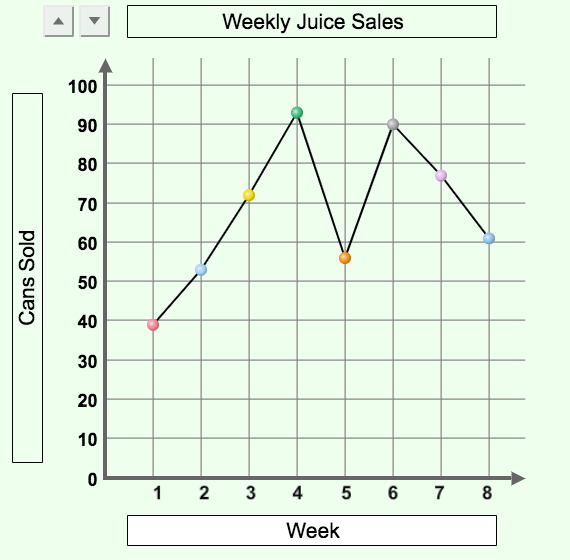
Identify the dependent (responding) variable by looking at the graph.
37
Multiple Choice
Identify the independent (manipulated) variable by looking at the graph.
38
Multiple Choice
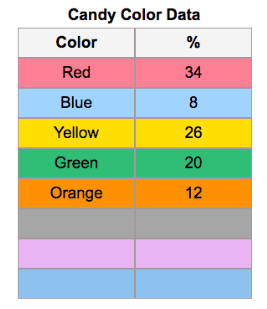
Based on the table provided, which type of graph would be best for the data?
39
Multiple Choice

What is this graph missing?
40
Multiple Choice

What is the independent variable (manipulated variable) in this experiment?
Show answer
Auto Play
Slide 1 / 40
SLIDE
