Search Header Logo
Hw 13; Unit 4 test Review

Hw 13; Unit 4 test Review

Assessment

Presentation

Mathematics

9th - 12th Grade

Hard

CCSS
HSS.ID.C.8, HSS.ID.C.9, 6.SP.B.5

+16

Standards-aligned

Created by

Jesse Idy

FREE Resource

8 Slides • 36 Questions

1

This HW is similar to the upcoming test on Unit 4: Statistics

​Be sure to have a paper and calculator in hand!

2

Topic 1: Correlation

Calculator Steps to find the Correlation Coeficent (r):

To add data: To find correlation (r=)

  1. Stat

  2. Edit

  3. Put in data for L1 and L2

  1. Stat

  2. Calc

  3. Click on #4 Lin Reg

  4. Enter, Enter, Enter, Enter

3

Topic 2: Linear Regression

Calculator Steps to find the Linear Regression Equation (y=ax+b):
To add data: To find the linear reg round a and b
plug into equation

  1. Stat

  2. Edit

  3. Put in data for L1 and L2

  1. Stat

  2. Calc

  3. Click on #4 Lin Reg

  4. Enter, Enter, Enter, Enter

4

Multiple Choice

Correlation coefficient is the statistic that measures the strength and direction of a linear relationship between two variables.

1

True

2

False

5

Multiple Choice

If r=0, there is a strong correlation.

1

True

2

False

6

Multiple Choice

A correlation shows that two things are
1
related
2
causing each other
3
unrelated

7

Multiple Choice

Which example shows CORRELATION?
1
I put water in the freezer and now I have ice.
2
The alarm clock went off and I woke up.
3
Temperature and the amount of people at the beach.

8

Multiple Choice

Question image
Estimate the value of r:
1
0.03
2
-1
3
0.79
4
- 0.72

9

Multiple Choice

Question image

What type of correlation does this graph have?

1

Positive correlation

2

Negative correlation

3

No correlation

4

Constant correlation

10

Multiple Choice

Question image

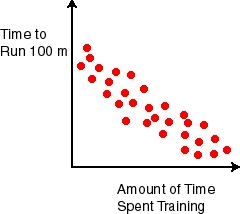
What type of correlation does this scatter plot show?

1

Positive correlation

2

Negative correlation

3

No correlation

4

Constant correlation

11

Multiple Choice

Question image
Estimate the correlation coefficient for this scatterplot.
1
r = 1.2
2
r = 0.89
3
r = 0
4
r = -0.89

12

Multiple Choice

Question image

Given the following Scatter Plot, select the option that is most likely the r value.

1

r=.45r=-.45

2

r=.981r=-.981

3

r=.728r=.728

4

r=.12r=.12

13

Multiple Choice

Question image

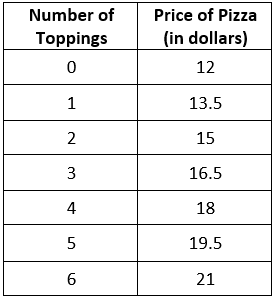
A restaurant sells pizza for the prices in the data table. Calculate the linear regression equation of the data.

Use the steps to find it in your calculator.

1

y = 1.5x + 12

2

y = 12x + 1.5

3

y = 0.67x - 8

4

y = -8x + 0.67

14

Multiple Choice

Question image

What is the closest correlation coefficent for the set of data in the table?

(look at your calculator)

1

r=.95

2

r= -.55

3

r= -. 94

4

r=.21

15

Multiple Choice

In a scatterplot, an outlier...
1

...is something we didn't learn

2
...is a puppet with a long nose named Pinocchio
3
...is a point that is far outside the main cluster of points/ordered pairs
4
...is a really naughty point who doesn't tell the truth when outside

16

Multiple Choice

r = -0.3 is considered to have...

1

moderate negative correlation

2

weak negative correlation

3

no correlation

4

strong negative correlation

17

Multiple Choice

Question image

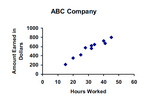
A person travels by car.  They record their miles driven in a data table.  Calculate the linear regression equation of this data.
(keep this information on your calculator for the next question)

1
y = 61.93x - 1.79
2
y = -1.79x + 61.93
3
y = 0.016x + 0.03
4
y = 0.03x + 0.016

18

Multiple Choice

Question image

Explain what the correlation correlation means in the context of this situation

1

There is a strong positive correlation between the time driving and the total distance driven in miles

2

There is a weak positive correlation between the time driving and the total distance driven in miles

3

There is a strong negative correlation between the time driving and the total distance driven in miles

4

There is no correlation between the time driving and the total distance driven in miles

19

Mean
Median
Standard Deviation
Minimum/ Maximum (Range)
Q1 and Q3 (IQR)
Outliers

We use 1 Var Stats to find the:

Topic 3: 1 Var Stats

Dot Plots
Whisker Plots
Outlier Formula

20

Multiple Choice

What does this symbol represent? x\overline{x}  

1

standard deviation

2

median

3

mode

4

mean

21

Multiple Choice

Compare the mean and median of the following set: 1, 2, 3, 4, 5.

1

Mean is greater than median

2

Mean is less than median

3

Mean is equal to median

4

Cannot be determined

22

Multiple Choice

Determine the IQR for this set of data. 12, 13, 14, 15, 17, 18, 19, 19, 22, 23

1

14

2

5

3

17.5

4

19

23

Multiple Choice

What is the standard deviation of the sample:

22,19,45,10,13,9

1

15.856

2

13.411

3

12.243

4

19.66

24

Box and Whisker Plots

media

IQR = Q3 - Q1

25

Multiple Choice

Question image
What is the median of the data?
1
200
2
100
3
90
4
140

26

Multiple Choice

Question image
What data value is the upper quartile (Q3)?
1
64
2
62
3
66
4
58

27

Multiple Choice

Question image
Which box and whisker plot has the highest median?
1
Top plot
2
Bottom plot

28

Dot Plots

media

29

Multiple Choice

Question image

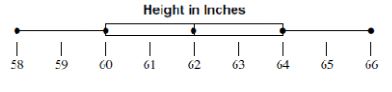
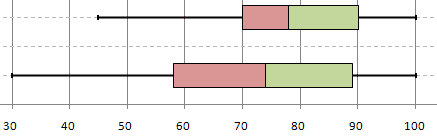
What is the range of the data shown?

(Range= Max- Min)

1

82

2

2

3

3

4

83

30

Multiple Choice

Question image

How many total students were surveyed about their number of brothers and sisters? (add up all of the dots)

1

15

2

10

3

6

31

Multiple Choice

Question image

What is the mode of the data?

(Mode= number that repeats most)

1

2

2

1

3

4

4

12

32

Multiple Choice

Question image

How many students did their homework in less than 6 hours?

1

5

2

6

3

3

4

4

33

Multiple Choice

Question image
How many students spent 7 hours doing homework that week?
1
1
2
3
3
5
4
6

34

Two Way Frequency Tables

media
media

​Some questions will ask you to find percentages on the table's data... use

Some questions will ask you to fill in the rest of the values by subtracting from the total

35

Multiple Choice

Question image
What percentage of males drive sports cars?
1
35%
2
16.25%
3
65%
4
25%

36

Multiple Choice

Question image
How many sophomores like burritos and pizza?
1
6
2
5
3
11
4
50

37

Multiple Choice

Question image
How many people purchased no food and no drink?
1
60
2
10
3
20
4
200

38

Multiple Choice

Question image

What percentage of students choose waffles?

1

27

2

30

3

37%

4

33%

39

Outlier Formulas

media

40

Multiple Choice

How do we calculate the IQR of a data set?

1

Q1 + Q3

2

Q3 - Q1

3

Q1 - Q3

4

Q1 * Q3

41

Multiple Choice

When using the IQR to find outliers, which formula will identify the upper limit?

1

Q3 - 1.5(IQR)

2

Q1 + 1.5(IQR)

3

Q1 - 1.5(IQR)

4

Q3 + 1.5(IQR)

42

Multiple Choice

Given the data set: 23, 34, 27, 12, 30, 26, 28, 31, 34

Find the IQR.

1

8

2

9

3

24.5

4

32.5

43

Multiple Choice

Using the information below, identify which of the following is an outlier:
Q1 = 3
Q2 = 7
Q3 = 12
1
22
2
25.5
3
-8.5
4
26

44

Multiple Choice

Use the 1.5 IQR rule to determine if there are any outliers for the following numbers:
84, 88, 72, 74, 98, 16, 94 
1
Yes, 16 is an outlier.
2
Yes, 33 is an outlier.
3
Yes, 98 is an outlier.
4
There are no numbers less than 39 or greater than 124, therefore there are no outliers.

This HW is similar to the upcoming test on Unit 4: Statistics

​Be sure to have a paper and calculator in hand!

Show answer

Auto Play

Slide 1 / 44

SLIDE