
Scatter Plots
Presentation
•
Mathematics
•
9th - 12th Grade
•
Practice Problem
•
Medium
+13
Standards-aligned

Lauren Liberatore
Used 6+ times
FREE Resource
10 Slides • 30 Questions
1

2

3

4
Fill in the Blanks
5
Multiple Choice

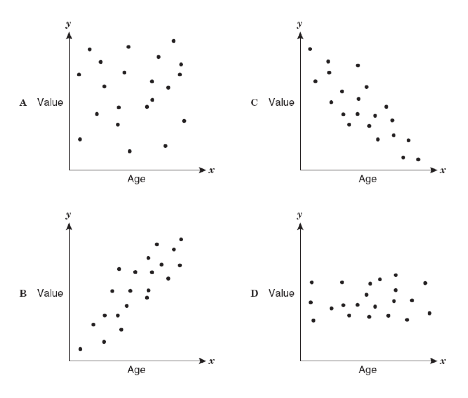
Can you guess the correlation?
6
Multiple Choice

Can you guess the correlation?
7
Multiple Choice

Can you guess the correlation?
8

9

10
Multiple Choice

What is the correlation between length of running start and distance of jump?
11
Multiple Choice

What type of association does this scatter plot show?
12
Multiple Choice
13
Multiple Choice
14
Multiple Choice

15

16
Multiple Choice
17

18
Multiple Choice
19

20
Multiple Choice
21
Multiple Choice

Determine the correlation.
22
Multiple Choice

23
Multiple Choice

Determine the correlation.
24
Multiple Choice

What type of relationship does this scatter plot show?
25
Multiple Choice
26
Multiple Choice
27
Multiple Choice

28
Multiple Choice
29
Multiple Choice

30
Multiple Choice

31
Multiple Choice

What represents the X axis?
32
Multiple Choice
What represents the Y axis?
33
Multiple Choice

What represents the X axis?
34
Multiple Choice
What represents the Y axis?
35

36
37
Multiple Choice

Which of the following lines represents the line of best fit for the scatter plot?
38
Multiple Choice

Which of the following lines represents the line of best fit for the scatter plot?
39
Multiple Choice

Which of the following lines represents the line of best fit for the scatter plot?
40
Multiple Choice

Which of the following lines represents the line of best fit for the scatter plot?
Show answer
Auto Play
Slide 1 / 40
SLIDE
