

Module 14 day 2 (interpreting bar graphs)

Presentation
•
Mathematics
•
3rd Grade
•
Practice Problem
•
Medium
•
CCSS
3.MD.B.3, 2.MD.D.10
Standards-aligned

Jamie Leach
Used 2+ times
FREE Resource
10 Slides • 8 Questions
1

2

3

4

5
Labeling
6

7

8

9
Open Ended

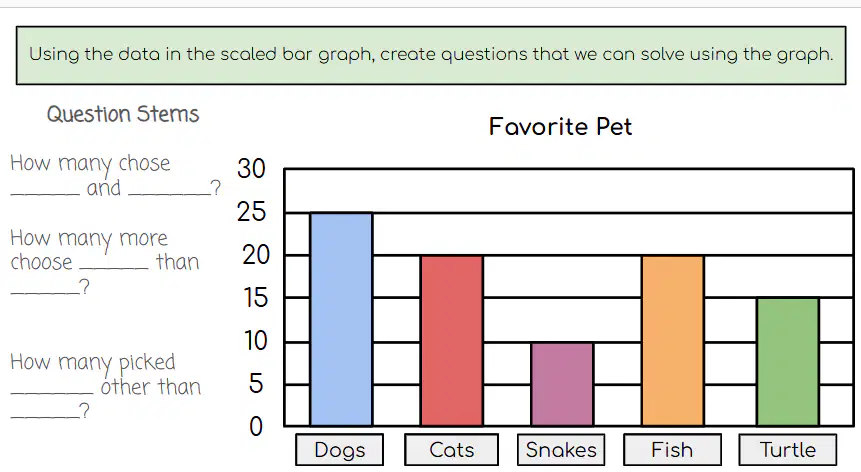
How many students chose baseball and football as their favorite sport?
10
Multiple Choice

How many students chose baseball and football?
11

12
Open Ended

How many more classmates choose sprinkles than chocolate syrup?
13
Multiple Choice

How many more classmates choose sprinkles than chocolate syrup?
14
15
Open Ended

How many students picked a favorite topping other than peanuts?
16
Open Ended

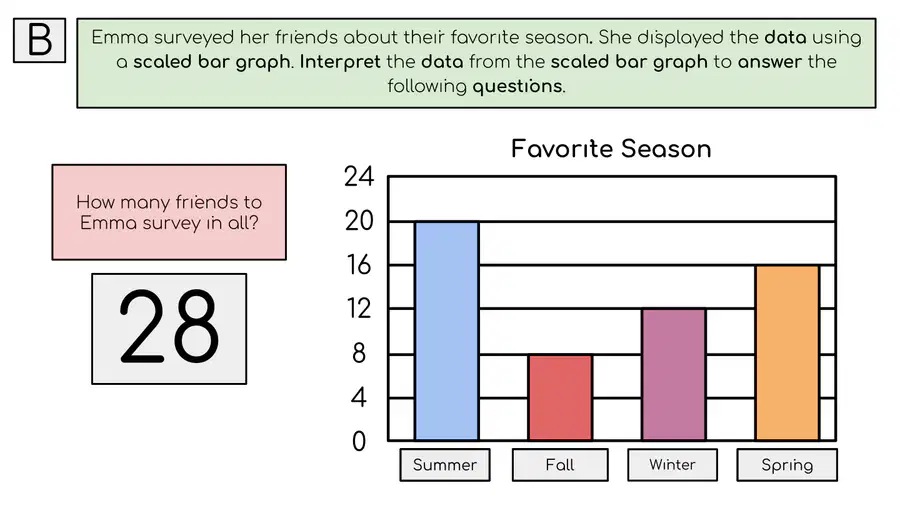
How many students took Owen's survey in all?
17
Multiple Choice

How many classmates took Owen's survey in all?
18
Show answer
Auto Play
Slide 1 / 18
SLIDE

