Search Header Logo
  1. Resource Library
  2. Math
  3. Probability And Statistics
  4. Center And Spread
  5. Measures Of Center And Spread
Measures of Center and Spread

Measures of Center and Spread

Assessment

Presentation

Mathematics

9th - 12th Grade

Hard

Created by

Joseph Anderson

FREE Resource

14 Slides • 14 Questions

1

Measures of Spread

Slide image

2

Slide image

3

Slide image

4

Slide image

5

Slide image

6

Slide image

7

Quick!

Are we understanding the shape?

Slide image

8

Multiple Choice

Question image

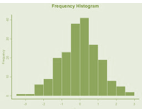
What is the shape of the data?

1

skewed left

2

symmetrical, bell shaped

3

symmetrical, u shaped

4

skewed right

9

Multiple Choice

Question image

Describe the shape of the graph.

1

Symmetrical

2

Skewed

3

Uniform

10

Multiple Choice

Question image

What is the shape of the Data Set?

1

Skewed Left

2

Symmetrical

3

Skewed Right

11

Multiple Choice

Question image

What is the shape of the Data Set?

1

Skewed Left

2

Symmetrical

3

Skewed Right

12

Multiple Choice

Question image

What is the shape of the Data Set?

1

Skewed Left

2

Symmetrical

3

Skewed Right

13

Slide image

14

Slide image

15

Slide image

16

Multiple Choice

In 2004 the standard deviation for the math score for males was 116 and the standard deviation of the math scores for females was 110. What can be concluded about the scores for males and females?

1

Since the standard deviation of the scores for the males was higher, the males scored better

on the test.

2

Since the standard deviation of the scores for the males was higher, the males left fewer

questions blank.

3

Since the standard deviation of the scores for females was lower, the scores for females were

more spread out than the scores for males.

4

Since the standard deviation of the scores for females was lower, the scores for females were

more consistent than the scores for males.

17

Multiple Choice

Question image

The distribution of SAT verbal scores shown in the histogram above is which of the following?

1

Skewed Right

2

Uniform

3

Approximately Normal

4

Bi-Modal

18

Multiple Choice

Question image

Based on the shape of the distribution of the Verbal SAT scores in 2004, which conclusion is

true?

1

the mean is to the right of the median


2

the mean is approximately equal to the median


3

the mean is significantly lower than the median


4

there is no way to determine the relationship between the mean and median

19

Multiple Choice

Question image

Based on the histogram of the Verbal SAT scores from 2004, the median score was likely which

of the following?

1

Near 500

2

Near 400

3

Near 600

4

it cannot be determined from the histogram provided

20

Multiple Choice

Question image

The table below shows the distribution of grades on a recent chemistry exam for two instructors.


Which of the following statements correctly compares the exam results?

1

The mean score in Nelson’s class would be higher than the mean score in Bailey’s class.

2

The standard deviation of Bailey’s class is smaller than the standard deviation of Nelson’s class.

3

The standard deviation of Nelson’s class is smaller than the standard deviation of Bailey’s class.

4

The mean score and standard deviation of exam scores are the same for the two classes.

21

Slide image

22

Multiple Choice

Question image

Which of the following statements correctly describes the spread of the data above?

1

The range of both classes is similar.

2

Nelson’s class is more likely to have an outlier in the data.

3

Bailey’s class would give a more uniform distribution.

4

Nelson’s class would give a more skewed distribution.

23

Multiple Choice

Question image

The table above shows the recorded lengths of 20 walkers at a recent community event. The last entry, 26, is an error that was incorrectly recorded. If this outlier is removed from the data, which of the following will change the most?

1

Range

2

Median

3

Mean

4

They will change by the same amount.

24

Multiple Choice

Question image

The histogram above displays the amount of time (in hours) that a group of 115 students attended tutoring prior to a final exam. In the histogram, the first bar represents the students who attended less than 2 hours of tutoring; the second bar represents the students who attended at least 2 hours , but less than 4 hours; and so on. Which of the following could be the mean and median amount of tutoring, in hours, for the 115 students?

1

Mean=7.2 Median=8

2

Mean=9.4 Median=11

3

Mean=8.0 Median=10

4

Mean=9.1 Median=9

25

Multiple Choice

Question image

What type of distribution does the above histogram show?

1

Uniform

2

Skewed Right

3

Skewed Left

4

Approximately Normal

26

You're on your own for the last 2 questions!

27

Slide image

28

Slide image

Measures of Spread

Slide image

Show answer

Auto Play

Slide 1 / 28

SLIDE