Search Header Logo
Scatterplots and Functions

Scatterplots and Functions

Assessment

Presentation

Mathematics

8th Grade

Hard

Created by

Joseph Anderson

FREE Resource

3 Slides • 7 Questions

1

Functions and Scatterplots Retest

2

  • x CANNOT repeat for a function.

  • Graphs- vertical line test

  • Bubble Mapping- one line connected to an x.

  • Table- x cannot repeat

Identifying Functions

media

3

Multiple Choice

Question image

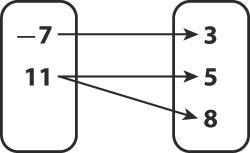
Is the relation a function? Why.

1

Yes, because the x-value 11 has two y-values paired with it.

2

Yes, because each x-value has only one y-value paired with it.

3

No, because the x-value 11 has two y-values paired with it.

4

No, because each x-value has only one y-value paired with it.

4

Multiple Choice

Question image

Is this table a function or not a function?

1

Function

2

Not a Function

5

Multiple Choice

Question image

Is this graph a function or not a function?

1

Function

2

Not a Function

6

You can use trend lines (or line of fit) to predict other values of y or x.

Scatter Plots

media

7

Multiple Choice

Question image
What type of association does this graph have?
1
positive 
2
negative
3
none
4
all of the above

8

Multiple Choice

Question image
What type of association does this graph have?
1
positive
2
negative
3
none
4
all of the above

9

Multiple Choice

Question image
Make a prediction for a resting heart rate after 6 hours of exercise a week.
1
6
2
50
3
55
4
59

10

Multiple Choice

Question image
If the carpenter worked for 6 days, how much did he earn?
1
1250
2
1500
3
1750
4
2000

Functions and Scatterplots Retest

Show answer

Auto Play

Slide 1 / 10

SLIDE