
Shape Center Spread and Variability
Presentation
•
Mathematics
•
6th Grade
•
Hard
Joseph Anderson
FREE Resource
7 Slides • 11 Questions
1
Shape, Center, Spread of Data
By Kaylie Eckhout
2
Find the median in a nonsymmetrical distribution. In a bell shaped or symmetrical the mean and median are the same thing.
Center
Center and Spread of Data
To find the spread find the "Range" by subtracting your biggest and smallest numbers.
Spread
3
Multiple Choice
The number in the middle
The difference between the highest and lowest values
The number that occurs the most
The average
4
Multiple Choice
77
99
80
78.5
5
Multiple Choice
both sets of data have the same median
Ander's center is at 6
Marcus's center is at 7
Ander's spread is greater than Marcus's
6
Peak- the highest point of data
Cluster- a group of data together.
Clusters and Peaks
7
Multiple Choice
What is a peak on a graph.
The highest point in a cluster.
No point at all.
The lowest point.
All of the Above.
8
Multiple Choice
What is a Gap?
A space in between data points
That clothing company
Two close together data points
9
Multiple Choice
What number is the peak?
Less than 15
50
Greater than 65
60
10
Multiple Choice
Describe the clusters in this distribution.
There is a cluster from 16-21.
There is no cluster because the data is all together.
11
Shape
Bell, Uniform, Symmetrical
In this type of graph, the mean and the median are the same
12
Shape
Skewed Right
In this type of graph, the median is less than the mean
13
Shape
Skewed Left
In this type of graph, the median is greater than the mean
14
Multiple Choice
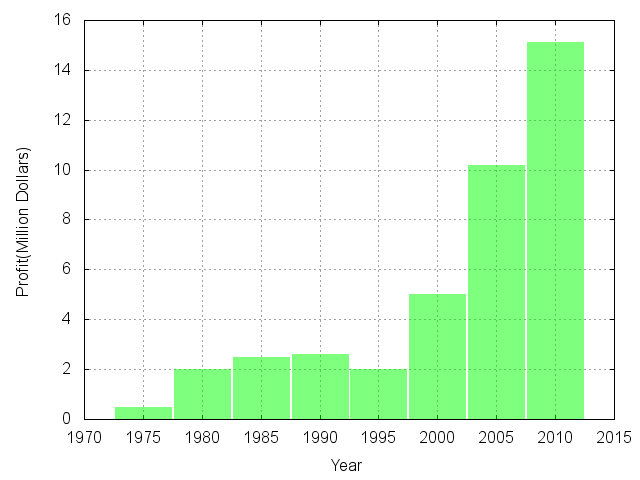
What is the shape of this bar graph?
Skew right
Skew left
Symmetrical
uniform
15
Multiple Choice
skewed left
skewed right
symmetrical
16
Multiple Choice
Describe the shape of Daniel's data
skewed left
skewed right
symmetrical
17
Outlier
An outlier is a value far from the rest of the data in a set
Removing or adding an outlier will affect the range
Removing or adding an outlier will not (most of the time) affect the median
Removing or adding an outlier will affect the mean
18
Fill in the Blank
Type answer...
Shape, Center, Spread of Data
By Kaylie Eckhout
Show answer
Auto Play
Slide 1 / 18
SLIDE
Similar Resources on Wayground
14 questions
Rates and Unit rate
Presentation
•
6th Grade
14 questions
One-Step Equations (Multiplication/Division)
Presentation
•
6th Grade
12 questions
Adding and Subtracting Integers
Presentation
•
6th Grade
13 questions
Volume
Presentation
•
6th Grade
13 questions
6th Grade STAAR Review #1
Presentation
•
6th Grade
13 questions
Converting Improper Fractions and Mixed Numbers
Presentation
•
6th Grade
14 questions
One Step Inequalities
Presentation
•
6th Grade
12 questions
Decimal to Percent
Presentation
•
6th Grade
Popular Resources on Wayground
10 questions
5.P.1.3 Distance/Time Graphs
Quiz
•
5th Grade
10 questions
Fire Drill
Quiz
•
2nd - 5th Grade
20 questions
Equivalent Fractions
Quiz
•
3rd Grade
22 questions
School Wide Vocab Group 1 Master
Quiz
•
6th - 8th Grade
20 questions
Main Idea and Details
Quiz
•
5th Grade
20 questions
Context Clues
Quiz
•
6th Grade
20 questions
Inferences
Quiz
•
4th Grade
12 questions
What makes Nebraska's government unique?
Quiz
•
4th - 5th Grade
Discover more resources for Mathematics
10 questions
Box Plots
Quiz
•
6th - 7th Grade
20 questions
Graphing Inequalities on a Number Line
Quiz
•
6th - 9th Grade
20 questions
Box and Whisker Plots
Quiz
•
6th Grade
20 questions
Ratios/Rates and Unit Rates
Quiz
•
6th Grade
15 questions
Distributive Property & Review
Quiz
•
6th Grade
15 questions
One- Step Equations
Quiz
•
6th Grade
20 questions
Statistical VS Non-Statistical Questions
Quiz
•
6th Grade
10 questions
One Step Equations (Addition and Subtraction)
Quiz
•
6th - 7th Grade