Search Header Logo
  1. Resource Library
  2. Math
  3. Probability And Statistics
  4. Box And Whisker Plot
  5. Comparing Box And Whisker Plots
Comparing Box and Whisker Plots

Comparing Box and Whisker Plots

Assessment

Presentation

Mathematics

6th - 9th Grade

Hard

Created by

Joseph Anderson

FREE Resource

6 Slides • 26 Questions

1

Comparing Box Plots

By Courtney Tout

2

7.4D Reteach

media

Wednesday's Practice Problems​

3

Multiple Choice

Question image

How far did they travel after the 7 hours?

1

A

2

B

3

C

4

D

4

Multiple Choice

Question image

Use the Template:

% Change = DifferenceOriginal\%\ Change\ =\ \frac{Difference}{Original}  

1

8%

2

80%

3

60%

4

40%

5

media

I Do

Some text here about the topic of discussion.

6

media

Follow Along with your notes.

Let's Identify the 5 number summary:

Minimum, Q1, Medium, Q3, Maximum​

This is a Box Plot.

Each Box Plot tells us:

Minimum

Maximum

Medium

Quartile 1

Quartile 2​

Interquartile Range​

Range​

7

Multiple Choice

Question image

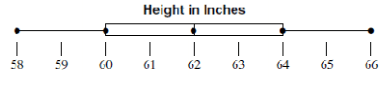
Where is the maximum located?

1
2
3
4

8

Multiple Choice

Question image

Where is the Median located?

1
2
3
4

9

Multiple Choice

Question image

Where is Quartile 1 or Q1 located?

1
2
3
4

10

Multiple Choice

Question image

Where is Quartile 3 or Q3 located?

1
2
3
4

11

Multiple Choice

Question image

Where is IQR found?

1
2
3
4

12

Multiple Choice

Which of the following best describes the process of finding the interquartile range for a set of data?
1
Add the biggest and smallest numbers.
2
Place the numbers in order from least to greatest and find the middle.
3
Find the difference between the maximum and the minimum.
4
Subtract Q1 from Q3.

13

media

We Do

Some text here about the topic of discussion.

14

Multiple Choice

Question image

What is the Median?

1

48

2

52

3

57

4

4

15

Multiple Choice

Question image

What is the IQR?

Hint: Q3 - Q1

1

49

2

51

3

6

4

57

16

Multiple Choice

Question image
What is the minimum value?
1
64
2
58
3
66
4
60

17

Multiple Choice

Question image
What is the maximum value?
1
58
2
66
3
64
4
60

18

Multiple Choice

Question image
What value is the lower quartile?
1
66
2
58
3
60
4
64

19

Multiple Choice

Question image
What is the median?
1
62
2
58
3
66
4
60

20

Multiple Choice

Question image
What is the interquartile range (IQR)?
1
4
2
64
3
60
4
8

21

Multiple Choice

Question image
What is the median of the data?
1
200
2
100
3
90
4
140

22

Multiple Choice

Question image

What is the interquartile range (IQR)?

1

20

2

25

3

30

4

50

23

Multiple Choice

Question image
Find the Maximum
1
14
2
20
3
5
4
12

24

media

You Do

Some text here about the topic of discussion.

25

Multiple Choice

Question image
What is the interquartile range for the Checkers Club?
1
4
2
5
3
10
4
11

26

Multiple Choice

Question image
Which data set shows a greater spread?
1
Chess Club
2
Checkers Club
3
They have the same spread.
4
You cannot tell from the box plots. 

27

Multiple Choice

Question image
Which car club has the higher median?
1
Cruisers
2
Car Hops

28

Multiple Choice

Question image
Which box and whisker plot has the highest median?
1
Top plot
2
Bottom plot

29

Multiple Choice

Question image

Which car has the biggest maximum jump?

1

Car A

2

Car B

30

Multiple Choice

Question image

Which has a greater interquartile range?

1

Airplane A

2

Airplane B

3

Both the same

31

Multiple Choice

Question image

Which statement is true?

1

Airplane A has a lesser median

2

Airplane B has a greater range

3

Airplane A has a less predictable flight length

4

Airplane B a lesser IQR

32

Multiple Choice

Question image
1

The range of the data for Fun Fit is less than the range of the data for Greg’s Gym.

2

The median for Greg’s Gym is less than the median for Fun Fit.

3

The minimum attendance for Fun Fit is less than the minimum attendance for Greg’s Gym.

4

The interquartile range for Greg’s Gym is greater than the interquartile range for Fun Fit.

Comparing Box Plots

By Courtney Tout

Show answer

Auto Play

Slide 1 / 32

SLIDE