Search Header Logo
  1. Resource Library
  2. Math
  3. Data And Graphing
  4. Dot Plot
  5. Dot Plots And Frequency Tables
Dot Plots and Frequency Tables

Dot Plots and Frequency Tables

Assessment

Presentation

Mathematics

3rd Grade

Hard

Created by

Joseph Anderson

FREE Resource

5 Slides • 11 Questions

1

Discover new features in Lessons!
Finish all phases of “I-do ; We-do ; You-do” with Quizizz

media
media
media
media

​You can also create lessons directly on Google Slides using “Quizizz Extension”.
Read more about it here

2

Data Representations

  • Information collected about people, events or objects

  • Categorical or Numerical

  • Ways to collect: Survey, interview, polls, spontaneous

  • Ways to record: Frequency table, dot plot, stem-leaf plot

3

  • Organized in rows and columns

  • One tally=one representation

  • Quick for tallying a large amount of info​

Frequency Tables

media

4

  • Uses titles, subtitles, and labels

  • One "dot" = one representation

  • Each "dot" can represent > 1

Dot Plot

media

5

Multiple Choice

Frequency tables use marks called _______ to represent each representation.

1

frequencies

2

frequently

3

tallies

4

totals

6

Fill in the Blank

7

Multiple Choice

Question image
1

3

2

2

3

4

4

1

8

Multiple Choice

Question image
1

1 1/2

2

1/2

3

3/4

4

2

9

Multiple Choice

Question image
1

A

2

B

3

C

4

D

10

Multiple Choice

Question image
1

A

2

B

3

C

4

D

11

Multiple Choice

Question image
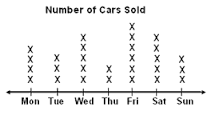
How many cars were sold on Saturday and Sunday?
1
5
2
3
3
8
4
10

12

Multiple Choice

Question image
How many strings were measured in all?
1
12
2
11
3
7
4
2

13

Multiple Choice

Question image
How many pieces of fudge sold on Saturday were smaller than 2 pounds? 
1
7 pieces
2
10 pieces
3
20 pieces
4
10 

14

Multiple Choice

Question image
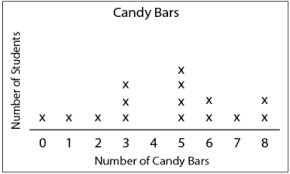
How many students had more than 6 candy bars?
1
5
2
2
3
3
4
1

15

Multiple Choice

Question image

What was the day with the least amount of cars sold?

1

Monday

2

Tuesday

3

Wednesday

4

Thursday

16

Remember

  • Each dot represents one representation unless otherwise stated

  • To find the total add the tallies/dots

  • Make sure that responses = tallies/dots (not more than one)

  • Label your axis' so that it is easy to graph and read

  • What do you want to know.....???

  • Questions?

Discover new features in Lessons!
Finish all phases of “I-do ; We-do ; You-do” with Quizizz

media
media
media
media

​You can also create lessons directly on Google Slides using “Quizizz Extension”.
Read more about it here

Show answer

Auto Play

Slide 1 / 16

SLIDE