

Interquartile Range and Box Plot
Presentation
•
Mathematics
•
6th Grade
•
Hard
Joseph Anderson
FREE Resource
21 Slides • 44 Questions
1
WARM UP!
Write your answers in your journals!
2
3
WATCH THIS!!
4
5
6
7
8
9
10
11
12
13
14
15
Multiple Choice
64
58
66
60
16
Multiple Choice
58
66
64
60
17
Multiple Choice
200
100
90
140
18
19
20
Let's Create Your
Box Plots!
Remember the steps!
Put all of the numbers in order: L to G
Label your min and max
Find the median
Find the median of the lower half (Q1)
Find the median of the upper half (Q3)
Find the IQR!
CONGRATULATIONS!!
Your Box Plots should look like..
21
22
23
24
25
Multiple Choice
What percentage of the data is between 90 and 140?
25 %
50%
75%
100%
26
Multiple Choice
What percentage of the data is between 40 and 90?
25 %
50%
75%
100%
27
Multiple Choice
What percent of the data is between 30 and 35 on the number line?
25%
50%
75%
100%
28
Multiple Choice
4
64
60
8
29
Multiple Choice
30
Multiple Choice
64
62
66
58
31
Multiple Choice
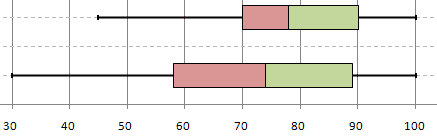
Which car club has the higher median?
Cruisers
Car Hops
Neither. Can't determine median from the graph.
32
Multiple Choice
Upper Quartile
Lower Quartile
Median
Minimum
33
Multiple Choice
127
155
156
193
34
Multiple Choice
66
58
60
64
35
Multiple Choice
Lower Quartile
Upper Quartile
Median
Maximum
36
Multiple Choice
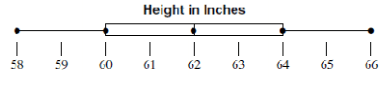
What is the interquartile of this data?
50
90
110
100
37
Multiple Choice
If 60 values were used for the data, about how many data values are greater than the 1st quartile?
15
30
45
60
38
Multiple Choice
39
Multiple Choice
What is the upper quartile of this data?
40
90
100
140
150
40
Multiple Choice
Top plot
Bottom plot
41
Multiple Choice
Which has a higher median?
Florida
Texas
42
Multiple Choice
Which data set shows students who tend to spend more time on homework per week?
Finn's Data Set
Jonah's Data Set
43
Multiple Select
Mr. Jackson had students grow the same type of plant in two different rooms to test the growing conditions. The results are shown in the box plant. Choose ALL accurate statements below.
Room 7G has the tallest plant.
75% of 7D plants are 8 in. or taller.
7G has a greater median height.
Room 7D has the shortest and tallest plants.
44
Multiple Choice
Kerron gathers the heights of a random sample of 6th graders and 7th graders and displays the data in box plots. Which statement below is true?
The median of the 7th grade sample is greater than the 6th grade sample.
The 7th grade sample has greater variability.
The ranges of both data samples are equivalent.
The median of the 6th grade sample is greater than the 7th grade sample.
45
Multiple Choice
Mykel surveyed 15 7th graders and 15 8th graders at his school to see how many hours they spend per day listening to music. He made two box plots to compare the data sets. What inference can he draw from the data sets?
The range is greater for the 8th graders, so there is greater variability for the 8th graders than the 7th graders.
The person who listens to music the least is a 7th grader.
The median is greater for the 7th graders, so they generally spend more time listening to music than 8th graders.
No inferences can be made from the box plots.
46
Multiple Choice
Using the box plot, who spend more time in outdoor activity? Explain.
Soccer players, because they have a greater range of active minutes outdoors.
Basketball players, because they have a greater range of active minutes outdoors.
Soccer players, because they have a greater median of minutes spent outdoors.
Basketball players, because they have a greater median of minutes spent outdoors.
47
Multiple Choice
Which has a lower median?
Florida
Texas
48
Multiple Choice
Which has a lower IQR? (Interquartile Range)
Florida
Texas
49
Multiple Choice
What is Florida's median?
10
15
12
18
50
Multiple Choice
Which has the higher median?
Thanksgiving
New Years Eve
51
Multiple Choice
What is Thanksgivings maximum?
30
15
22
24
52
Multiple Choice
Which has a greater median?
Week 1
Week 2
53
Multiple Choice
Which has a lower IQR? (Interquartile Range)
Week 1
Week 2
54
Multiple Choice
True or False: Week 2 median is the same as Week 1 Q3
False
True
55
Multiple Choice
Which has a higher median?
6th graders
4th graders
56
Multiple Choice
Which has a greater IQR? (Interquartile Range)
6th graders
4th graders
57
Multiple Choice
Which has a lower IQR? (Interquartile Range)
6th graders
4th graders
58
Multiple Choice
59
Multiple Choice
60
Multiple Choice
Which box and whisker plot has the lowest minimum?
Top plot
Bottom plot
61
Multiple Choice
62
Multiple Choice
In a box and whisker plot, what is a name for the lowest number (the end of the whisker.)
Minimum
Maximum
Lower Quartile
First Quartile
63
Multiple Choice
In a box and whisker plot, what is a name for the highest number (the top end of the whisker.)
Minimum
Maximum
Upper Quartile
Median
64
Multiple Choice
How do you find the IQR (Interquartile range)?
add the five number summary
subtract the median from the maximum
subtract the minimum from the maximum
subtract quartile 1 from quartile 3
65
Multiple Choice
The "box" contains ALL of the following EXCEPT...
Maximum
Quartile 1
Quartile 3
Median
WARM UP!
Write your answers in your journals!
Show answer
Auto Play
Slide 1 / 65
SLIDE
Similar Resources on Wayground
56 questions
Congruence January 27
Presentation
•
6th Grade
60 questions
Lesson 3 Thermal Energy Transfers
Presentation
•
6th Grade
59 questions
Module 5 Exam Practice (Algebraic Expressions)
Presentation
•
7th Grade
60 questions
Ratio Reasoning
Presentation
•
7th Grade
63 questions
Lesson1 Solar Energy on Earth
Presentation
•
6th Grade
60 questions
Understanding Mean
Presentation
•
6th Grade
60 questions
Proportional Reasoning
Presentation
•
7th Grade
59 questions
Expanding Double Brackets
Presentation
•
7th Grade
Popular Resources on Wayground
10 questions
5.P.1.3 Distance/Time Graphs
Quiz
•
5th Grade
10 questions
Fire Drill
Quiz
•
2nd - 5th Grade
20 questions
Equivalent Fractions
Quiz
•
3rd Grade
22 questions
School Wide Vocab Group 1 Master
Quiz
•
6th - 8th Grade
20 questions
Main Idea and Details
Quiz
•
5th Grade
20 questions
Context Clues
Quiz
•
6th Grade
20 questions
Inferences
Quiz
•
4th Grade
12 questions
What makes Nebraska's government unique?
Quiz
•
4th - 5th Grade
Discover more resources for Mathematics
10 questions
Box Plots
Quiz
•
6th - 7th Grade
20 questions
Graphing Inequalities on a Number Line
Quiz
•
6th - 9th Grade
20 questions
Box and Whisker Plots
Quiz
•
6th Grade
20 questions
Ratios/Rates and Unit Rates
Quiz
•
6th Grade
15 questions
Distributive Property & Review
Quiz
•
6th Grade
15 questions
One- Step Equations
Quiz
•
6th Grade
20 questions
Statistical VS Non-Statistical Questions
Quiz
•
6th Grade
10 questions
One Step Equations (Addition and Subtraction)
Quiz
•
6th - 7th Grade