
Lesson on Two-Way Tables
Presentation
•
Mathematics
•
8th Grade
•
Hard

Joseph Anderson
FREE Resource
5 Slides • 7 Questions
1
Lesson: Two Way Table and Frequency Chart

2
Two Way Table 1
The question asks what percent of girls have blonde hair. In order to determine a percent, I must first know the total number of girls. Add the numbers in the "girl column" 5+6+8+1=20 total girls. The number of girls with blonde hair is 6. To find a percent we say part divided by whole (total) so 6/20=.3 To change to a percent, move the decimal two places to the right and the answer is 30% of the girls have blonde hair.

3
Calculating from a word problem.
The question tells me I have a total of 25 students. 80% have an A average, but the question is asking how many students DO NOT HAVE AN A AVERAGE. Always make sure you answer the question being asked. We know that 100% makes up a total amount...it means all of! So if 80% have an A average, then 20% DO NOT have an A average, because 100-80=20. Now take .20 x 25 ( that is 25% of 25 students) and you get your answer...5 students do not have an A average.

4
2 Way Table-Be careful...answer the question being asked :)
The question is asking you to find the group that liked action movies the LEAST! Look under the Action column and find the smallest number.You will find it was the age group 18-25.

5
Relative Frequency...how often does something occur?
The question is asking asking only about boys. Remember, to find a percent take the part divided by the whole. The whole would be the total number of boys...in this case,11. We want to know how many can't bike to school...that number is 4. So I say 4/11=.3636.. Move the decimal two places to the right and round to the nearest whole number. Approximately 36% of the boys cannot ride a bike to school.

6
Multiple Choice

The table shows incomplete info about customers' orders in a cafe. How many women visited the cafe in total?
7
Multiple Choice

How many total people were surveyed?
8
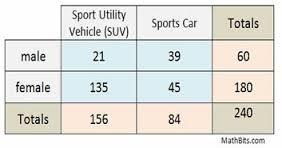
Multiple Choice

What percentage of SUV's are driven by women?
9
Multiple Choice

How many children prefer vanilla ice cream?
10
Multiple Choice

How many adults took this survey?
11
Multiple Choice

12
Multiple Choice
Lesson: Two Way Table and Frequency Chart
Show answer
Auto Play
Slide 1 / 12
SLIDE
