
Correlation Coefficient
Presentation
•
Mathematics
•
9th Grade
•
Hard

Joseph Anderson
FREE Resource
7 Slides • 17 Questions
1

2
3
Multiple Choice
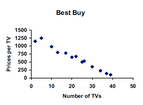
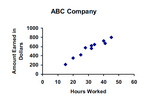
What type of correlation does this graph have?
4
Multiple Choice

What type of correlation does this scatter plot show?
5
Multiple Choice
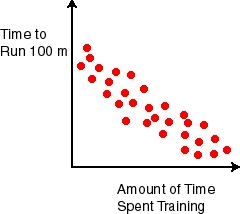
What type of correlation does this scatter plot show?
6

7
Multiple Choice
8
Multiple Choice
9
Multiple Choice
Estimate the correlation coefficient for this scatterplot.
10
Multiple Choice
11
Multiple Choice
12
Multiple Choice
13
14
Multiple Choice
15
Multiple Choice
16
Multiple Choice

Which of the following lines represent the line of best fit for the scatter plot.
17
Multiple Choice

Which of the following lines represents the line of best fit for the scatter plot?
18
19

20

21
Multiple Choice

Using your graphing calculator determine the line of best fit and the correlation coefficient of the data in the table.
22
Multiple Choice

What is the correlation coefficient of the data characteristics shown?
23
Multiple Choice

As shown in the table, a person's target heart rate during exercise changes as the person gets older. Use the graphing calculator to find the correlation coefficient (r).
24
Multiple Choice

Show answer
Auto Play
Slide 1 / 24
SLIDE
