Search Header Logo
Describe Data Distributions

Describe Data Distributions

Assessment

Presentation

Mathematics

6th Grade

Hard

Created by

Joseph Anderson

FREE Resource

5 Slides • 15 Questions

1

Describing Data
Distributions

2

media

3

Peak- the highest point of data

Cluster- a group of data together.

Clusters and Peaks

media
media

4

​Outlier

  • ​An outlier is a value far from the rest of the data in a set

  • ​Removing or adding an outlier will affect the range

  • Removing or adding an outlier will not (most of the time) affect the median

  • Removing or adding an outlier will affect the mean​

media

5

Multiple Choice

What is a peak on a graph.

1

The highest point in a cluster.

2

No point at all.

3

The lowest point.

4

All of the Above.

6

Multiple Choice

What is a Gap?

1

A space in between data points

2

That clothing company

3

Two close together data points

7

8

Multiple Choice

Question image

What number is the peak?

1

Less than 15

2

50

3

Greater than 65

4

60

9

Multiple Choice

Question image

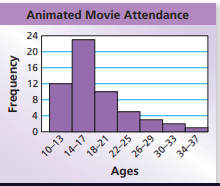
What is the shape of this bar graph?

1

Skew right

2

Skew left

3

Symmetrical

4

uniform

10

Multiple Choice

Question image
1

skewed left

2

skewed right

3

symmetrical

11

Multiple Choice

Question image

What type of distribution is given?

1

Right Skewed

2

Left Skewed

3

Normal

12

Multiple Choice

Question image
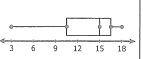
Describe the shape of the distribution.
 
1
Skewed Left
2
Skewed Right
3
Uniform
4
Normal

13

Multiple Choice

Question image
Describe the shape of the distribution.
 
1
Skewed Left
2
Skewed Right
3
Uniform
4
Normal

14

Multiple Choice

Question image
Describe the shape of the distribution.
 
1
Skewed Left
2
Skewed Right
3
Symmetric
4
Uniform

15

Multiple Choice

A data value that is much higher or much lower than the other values in a data set.
1
outlier
2
inlier
3
immalier
4
sublier

16

Multiple Choice

Question image

10.)Which of the following best describes the shape of the distribution?

1

SKEWED LEFT

2

SKEWED RIGHT

3

SYMMETRICAL

17

Multiple Choice

Question image

8.)What is the shape of the distribution?

1

Skewed Left

2

Skewed Right

3

Symmetric

4

Bimodal

18

Multiple Choice

Question image

5.)Which of the following best describes the shape of the distribution?

1

SKEWED LEFT

2

SKEWED RIGHT

3

UNIFORM

4

SYMMETRICAL

19

Multiple Choice

Question image

What is the shape of the data?

1

symmetrical

2

skewed left

3

skewed right

4

bell curve

20

Multiple Choice

Is there an outlier in the following set of data?


8, 45, 45, 47, 48, 48, 49, 50

1

yes

2

no

pattern-tertiary

Describing Data
Distributions

Show answer

Auto Play

Slide 1 / 20

SLIDE