
Dot Plots and Line Plots
Presentation
•
Mathematics
•
3rd Grade
•
Hard
+1
Standards-aligned
Joseph Anderson
FREE Resource
13 Slides • 5 Questions
1
Line Plots
2
3
What is a line plot?
A line plot is a type of graph.
Line plots show data with dots or Xs along a number line. Line plots can also be called dot plots.
For example, this line plot shows the number of children in each family on Josh's street.
4
Reading a line plot
Each dot shows one family.
The numbers on the number line show the number of children.
So, you can tell how many children are in the families on Josh's street:
5
Multiple Choice
How many families have 2 children?
0
3
2
4
6
Reading a line plot
There are two families with 0 children
There are two families with 1 child
There are three families with 2 children
There is one family with 4 children
7
Making Line Plots
You can make a line plot from a data set. Your data set might be in a list, a table, or a tally chart.
Let's try it! Make a line plot using the data in the table on the right on your white boards.
Alexa recorded the number of times each person in her family won a game during family game night.
Follow the steps on the next slide
8
Make a line plot
Step 1: make a number line.
The number of wins ranges from 0 wins to 3 wins. So, draw a number line from 0 to 3
9
Make a line plot
Step 2: draw dots or Xs to show the data from the table.
One person had 0 wins, so draw one data point above 0.
Three people had 1 win, so draw three data points above 1.
Nobody had 2 wins, so you don't need to draw any data points above 2.
One person had 3 wins, so draw one data point above 3.
10
11
Creating Fraction Line Plots
You can make a line plot to show a data set with fractions, too.
Let's try it! On your whiteboard make a line plot using the data in the tally chart below.
There are bottles on the counter in the science lab. Edward writes down the cups of liquid in each bottle.
12
Creating a Fraction Line Plot
1st Step: Make a number line.
The amount of liquid ranges from 0 cups to 1 cup.
The fractions in the data set count by fourths.
So, draw a number line from 0 to 1 that counts by fourths.
13
Creating Fraction Line Plots
14
15
Multiple Choice
How many people had 3 pets?
5
7
4
3
16
Multiple Choice
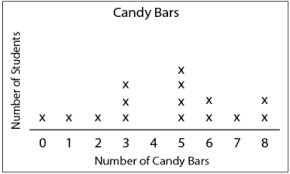
How many students had more than 6 candy bars?
5
2
3
1
17
Multiple Choice
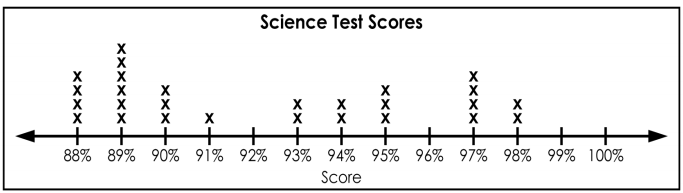
How many students received a score of 94%?
94
4
1
2
18
Multiple Choice
How many students have 0 Brothers and Sisters?
6 students
0 students
12 students
10 students
Line Plots
Show answer
Auto Play
Slide 1 / 18
SLIDE
Similar Resources on Wayground
13 questions
April 19th GMAS Math Review
Presentation
•
4th Grade
19 questions
Data Analysis
Presentation
•
3rd - 4th Grade
10 questions
Data, Charts, Graphs, and Plots
Presentation
•
2nd Grade
13 questions
Bar Graphs
Presentation
•
3rd Grade
11 questions
3 digit by 1 digit Division with and without Remainders
Presentation
•
4th Grade
15 questions
Reflectional Symmetry
Presentation
•
3rd Grade
18 questions
class 3 addition with regrouping
Presentation
•
3rd Grade
10 questions
Dot Plots
Presentation
•
3rd Grade
Popular Resources on Wayground
10 questions
5.P.1.3 Distance/Time Graphs
Quiz
•
5th Grade
10 questions
Fire Drill
Quiz
•
2nd - 5th Grade
20 questions
Equivalent Fractions
Quiz
•
3rd Grade
22 questions
School Wide Vocab Group 1 Master
Quiz
•
6th - 8th Grade
20 questions
Main Idea and Details
Quiz
•
5th Grade
20 questions
Context Clues
Quiz
•
6th Grade
20 questions
Inferences
Quiz
•
4th Grade
12 questions
What makes Nebraska's government unique?
Quiz
•
4th - 5th Grade
Discover more resources for Mathematics
20 questions
Equivalent Fractions
Quiz
•
3rd Grade
19 questions
Classifying Quadrilaterals
Quiz
•
3rd Grade
20 questions
Quadrilaterals
Quiz
•
3rd Grade
22 questions
fractions
Quiz
•
3rd Grade
15 questions
Rounding to the Nearest Ten and Hundreds
Quiz
•
3rd Grade
24 questions
Comparing Fractions
Quiz
•
3rd Grade
9 questions
Bar graphs and Pictographs
Quiz
•
3rd Grade
20 questions
Division Facts
Quiz
•
3rd Grade