Introduction to Tree Diagrams
Presentation
•
Mathematics
•
11th Grade
•
Hard

Joseph Anderson
FREE Resource
9 Slides • 16 Questions
1
Probability Trees - Part 1
Take notes while viewing this TWO-PART lesson.
Write down:
1) Definition and purposes of a tree diagram
2) Tree diagrams for flipping a coin 2 and 3 times
3) Rules on how to calculate probabilities and rules about probabilities within the tree/branches
4) Examples - include examples from EACH lesson.
2
Tree Diagram
A tree diagram is a branching structure that maps the outcomes of chances/probabilities (sample space).
The more branches, the more outcomes.
Example:
Take flipping a coin. Your only outcomes are heads and tails. So your tree would look like:
3
Flipping a Coin Twice:
If you flip the coin a second time you still only have the outcomes heads and tails but this time they branch out from your previous outcome. So your tree diagram looks like this:
Notice: The Sample Space. {HH, HT, TH, TT}
4
Multiple Choice
Which shows the sample space for flipping two coins?
H, T
HH, HT, TH, TT
HH, TT
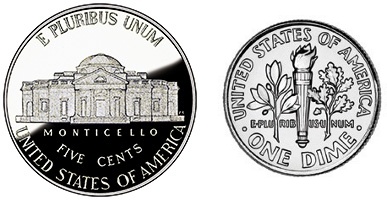
Dime, Nickel
5
Multiple Choice
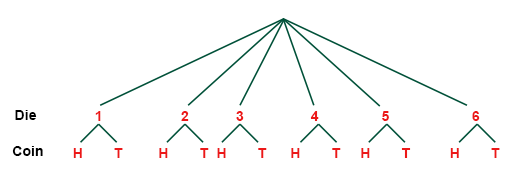
What is the sample space when you roll a die and then flip a coin?
1H, 2H, 3H, 4H, 5H, 6H, 1T, 2T, 3T, 4T, 5T, 6T
2
1,2,3,4,5,6,H,T
12
6
Multiple Choice
The cafeteria is serving three kinds of sandwiches: tuna (T), chicken, (C), and peanut butter (P). They are also serving a choice of two drinks: milk (M) or water (W). Which shows the sample space of possible combinations?
TW, CW, PW
TW, TM, TC, CW, PW
TW, TM, CW, CM, PW, PM
TCP, MW
7
Finding Probabilities of Compound Events:
To calculate the overall probabilities of each event in the sample space:
- MULTIPLY probabilities along branches.
- ADD probabilities down columns.
We can now see things like:
• The probability of getting heads then heads is 25%.
• All the probabilities add up to 1 or 100% .
• The probability of getting AT LEAST one head from two tosses is 0.25 + 0.25+ 0.25 = 0.75
8
Multiple Choice
What is the probability of randomly choosing a breakfast with a bagel and coffee?
1/8 because there is only 1 outcome out of the 8 possible choices that include both a bagel and coffee.
1/2 because there is only cereal and a bagel to choose from
1/4 because there is only one out of the four choices that include coffee
3 because the words "coffee" and "bagel" are on the diagram a total of 3 times.
9
Multiple Choice
Use the tree chart to find the probability of randomly picking an outfit with a white shirt and jeans.
There are 6 outfits
2/6, or 2 out of the 6 outfits have a white shirt with jeans
3/6, or 3 out of the 6 outfits have a white shirt with jeans
1/6, or 1 out of the 6 outfits has a white shirt with jeans.
10
Multiple Choice
The tree diagram shows the outcomes of rolling a die and flipping a coin.
What is the probability of rolling an even number and flipping a head?
3/12
1/2
4/12
0/12
11
Probability Trees - Part 2
12
Each section of the diagram should add up to a full one.
So in this case 0.7 + 0.3 = 1
13
Each additional section of the diagram should add up to a full one.
So in this case 0.6 + 0.4 = 1
14
Labelling
All probabilities must sum to 1, complete the two parts of the diagram.
0.7
0.25
0.8
0.25
15
Labelling
The diagram shows the chances of getting green and blue counters from a bag. Complete the section for the first counter.
1/7
1/9
7/8
8/1
1/8
16
Labelling
The diagram shows the chances of getting green and blue counters from a bag. Complete the diagram
1/7
1/9
7/8
8/1
1/8
17
18
19
Multiple Choice
What are the chances it will rain on both Monday and Tuesday?
0.32
0.08
0.48
0.12
20
Multiple Choice
What are the chances it will not rain on either Monday and Tuesday?
0.32
0.08
0.48
0.12
21
Multiple Choice
What are the chances it will not rain on Monday but will rain on Tuesday?
0.32
0.08
0.48
0.12
22
Multiple Choice
What are the chances it will only rain on one of the days?
0.56
0.08
0.48
0.4
23
Multiple Choice
The tree diagram shows the chances of two people's cards arriving on time. What are the chances they both arrive on time?
9/13
14/30
9/30
21/20
24
Multiple Choice
The tree diagram shows the chances of two people's cards arriving on time. What are the chances both are late?
3/30
7/30
6/30
3/10
25
Multiple Choice
The tree diagram shows the chances of two people's cards arriving on time. What are the chances one is late and one is on time?
1/30
7/30
6/30
13/30
Probability Trees - Part 1
Take notes while viewing this TWO-PART lesson.
Write down:
1) Definition and purposes of a tree diagram
2) Tree diagrams for flipping a coin 2 and 3 times
3) Rules on how to calculate probabilities and rules about probabilities within the tree/branches
4) Examples - include examples from EACH lesson.
Show answer
Auto Play
Slide 1 / 25
SLIDE

Similar Resources on Wayground
20 questions
Vertical and Horizontal Asymptotes
Presentation
•
11th Grade
20 questions
Classifying and Naming Angles
Presentation
•
10th Grade
20 questions
Transformations of Exponential Functions
Presentation
•
10th - 12th Grade
20 questions
Inverse Functions & Graphs
Presentation
•
10th - 12th Grade
19 questions
Plano Cartesiano!!
Presentation
•
12th Grade
20 questions
SPtLDV
Presentation
•
10th Grade
21 questions
4.4 Graphing sine and cosine Functions.
Presentation
•
11th Grade
Popular Resources on Wayground
10 questions
GPA Lesson
Presentation
•
9th - 12th Grade
7 questions
Albert Einstein
Quiz
•
3rd Grade
31 questions
Bridge A Review
Quiz
•
3rd Grade
6 questions
Blue Sue and Red Ruth
Quiz
•
3rd Grade
8 questions
(Day12 HW) Inverse Trig Ratios
Quiz
•
9th Grade
20 questions
Summer Geometry QUIZ (Week3)
Quiz
•
9th Grade
16 questions
Theme Practice
Quiz
•
7th Grade
20 questions
Taxes
Quiz
•
9th - 12th Grade