
Lesson on Correlation
Presentation
•
Mathematics
•
9th Grade
•
Hard

Joseph Anderson
FREE Resource
8 Slides • 21 Questions
1


2
Multiple Choice
3
Multiple Choice
4
Multiple Choice
5
Multiple Choice
6
7


8

9

10

11
Multiple Choice

12
Multiple Choice

13
Multiple Choice
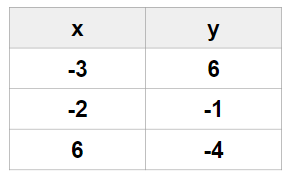
Write the linear regression equation for the following data points. Round to the nearest hundredth.
14
Multiple Choice
15
Multiple Choice

What is the line of best fit?
16
Multiple Choice

17
Multiple Choice

18
Multiple Choice

19
Multiple Choice

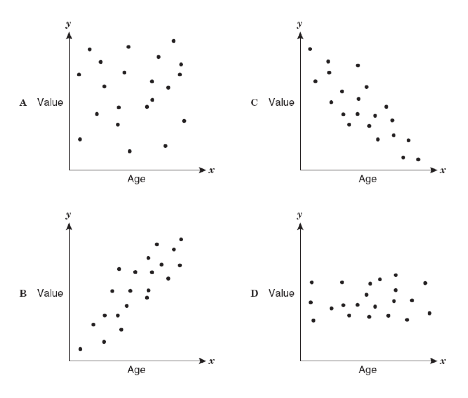
Which correlation coefficient (r) best represents the graph?
20
Multiple Choice
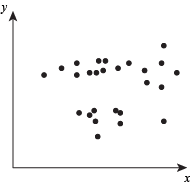
Which correlation coefficient (r) best represents the graph?
21
Multiple Choice
22
Multiple Choice
23
Multiple Choice

Which relationship is shown by this scatter plot?
24
Multiple Choice
25

26
Multiple Choice

The table shown is comparing a person's foot length to their height in cm. Calculate a line of best fit.
27
Multiple Choice

A person travels by car. They record their miles driven in a data table. Calculate the linear regression equation of this data.
28
Multiple Choice

What is the regression line?
29

Show answer
Auto Play
Slide 1 / 29
SLIDE
