
Scatterplots and Two-Way Tables
Presentation
•
Mathematics
•
8th Grade
•
Hard

Joseph Anderson
FREE Resource
35 Slides • 19 Questions
1

2
3
4
Multiple Choice

5
Multiple Choice
6
Multiple Choice
7
Multiple Choice

8
Multiple Choice

What is the equation of the line of best fit?
9
Multiple Choice

The scatter plot shows the relationship between the number of chapters and the total number of pages for several books. Use the line of best fit to predict how many pages would be in a book with 6 chapters.
10
Multiple Choice
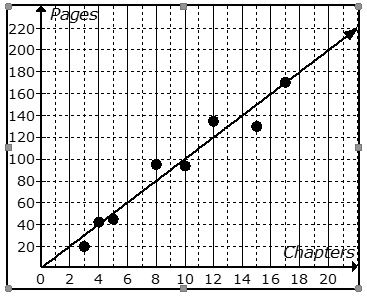
The scatter plot shows the relationship between the number of chapters and the total number of pages for several books. Use the line of best fit to predict how many chapters would be in a book with 140 pages.
11

12

13
Poll
14

15

16

17

18

19

20

21

22

23

24

25

26

27

28
Multiple Choice

29
Multiple Choice

30
Multiple Choice

31
Multiple Choice

32

33

34

35

36

37

38

39

40

41

42

43

44

45

46

47
48
Multiple Choice

How many total people were surveyed?
49
Multiple Choice

How many total have an MP3 player?
50
Multiple Choice
How many total have no cell phone?
51
Multiple Select

What would you divide to find the relative frequencies by row? (Select all that apply.)
52
Multiple Select
What would you divide to find the relative frequencies by column? (Select all that apply.)
53
Multiple Choice

How many attended the basketball game but did not attend the school play?
54
Multiple Choice
How many total did not attend the school play?
Show answer
Auto Play
Slide 1 / 54
SLIDE
