
Statistical Variable
Presentation
•
Mathematics
•
9th Grade
•
Hard

Joseph Anderson
FREE Resource
7 Slides • 56 Questions
1
Test Review: One-Variable and Two-Variable Statistics

2
3
Multiple Choice
4
Multiple Choice
5
Multiple Choice
6
Multiple Choice

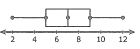
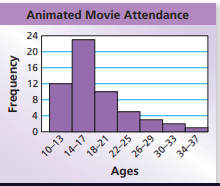
Which statement best describes this distribution?
7
Multiple Choice
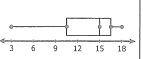
What is the shape of the data?
8
Multiple Choice
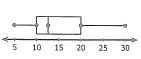
What is the shape of the data?
9
10
Multiple Choice

*Hint - If the data is uniform or symmetric, the use either mean or median. If the data is skewed, then use the median.
11
Multiple Choice
12
Multiple Choice
13
Multiple Choice
14
Multiple Choice

The table shows the points earned by contestants in a competition. Find the range and the interquartile range of the points.
15
Multiple Choice
16
Multiple Choice

17
18
Multiple Select
19
Multiple Select

The given data represents the ages of two softball teams. The data is represented by the box-and-whisker plots below.
Select all of the following statements about these data sets that are true.
20
Multiple Choice
21
Multiple Choice

What is the interquartile range (IQR) of the data set?
22
Multiple Choice

Which city, Nashville or Dallas, has the smallest minimum temperature?
23
Multiple Choice

What is the value of the upper quartile (Q3)?
24
Multiple Choice
What is the maximum value?
25
Multiple Choice
26
Multiple Choice

27
28
Multiple Choice
29
Multiple Choice

The box plots gives information about the time, in hours, taken by a random sample of male and female runners to complete a marathon.
One of the box plots has an outlier. What is the value of that outlier?
30
Multiple Choice
31
Multiple Choice

Which value(s) are outlier(s) for the age of male Oscar winners?
32
Multiple Choice
33
Multiple Choice

The data set below has an outlier of 42.
2, 5, 12, 15, 19, 4, 6, 11, 16, 18, 12, 12, 42
What effect does removing the outlier have on the measures of center?
34
Multiple Choice
35
Multiple Choice
36
Multiple Choice
37
38
Multiple Choice

What is the median test score on the 6TH Grade Math Test?
39
Multiple Choice

40
Multiple Choice

What is the best description of the data for Mr. Carson's class?
41
Multiple Choice

42
Multiple Choice

What percent of students have a height between 58 inches and 60 inches?
43
Multiple Choice

The box-and-whisker plot displays the number of inches of snowfall last year for 14 cities. Each city had a different amount of snowfall.
What percent of the cities had more than 64 inches of snow?
44
Multiple Choice

The middle 50% of scores were between....
45
Multiple Choice
What percentage of students scored a 39 or higher?
46
47
Multiple Choice
48
Multiple Choice
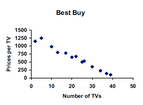
Estimate the correlation coefficient for this scatterplot.
49
Multiple Choice
50
Multiple Choice
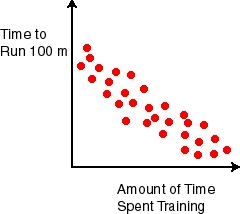
Estimate the correlation coefficient
51
Multiple Choice
Estimate the correlation coefficient.
52
Multiple Choice
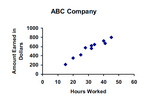
Estimate the correlation coefficient for this scatterplot.
53
Multiple Choice
54
Multiple Choice
55
Multiple Choice
56
Multiple Choice
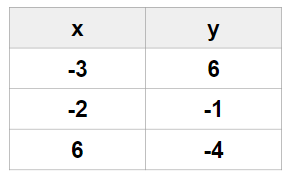
Write the linear regression equation for the following data points. Round to the nearest hundredth.
57
Multiple Choice
58
Multiple Choice

59
Multiple Choice

The annual profits for a company are given in the following table, where x represents the number of years since 1992, and y represents the profit in thousands of dollars. Write the linear regression equation that represents this set of data, rounding all coefficients to the nearest hundredth. Using this equation, estimate the year in which the profits would reach 378 thousand dollars.
60
Multiple Choice

61
Multiple Choice
62
Multiple Choice
63
Multiple Choice
Test Review: One-Variable and Two-Variable Statistics
Show answer
Auto Play
Slide 1 / 63
SLIDE
