Search Header Logo
Tuesday 3/24-3/28

Tuesday 3/24-3/28

Assessment

Presentation

Science

8th Grade

Medium

NGSS
MS-PS3-1

Standards-aligned

Created by

Alfonso Guzman

Used 5+ times

FREE Resource

14 Slides • 20 Questions

1

media

2

media

3

Match

Match the following

the change in speed or velocity over a specific amount of time; speeding up or slowing down

 the rate at which an object changes distance in 

a specific amount of time with a direction

the total distance an object traveled divided by the total amount of time elapsed

 the change in distance over a specific amount of time

Acceleration

Velocity

Average Speed

Speed

4

Open Ended

Question image

You are going on a walk. Create a story using the graph below

5

media

6

Multiple Choice

A student bounces a basketball off the gym floor.

Which statement correctly describes the action-reaction force pair that causes the ball to bounce?

1

The gym floor pushes up on the ball as the ball pushes down on the floor with an equal amount of force.

2

The gym floor pushes up on the ball with a greater amount of force than the ball pushes down on the floor.

3

The gym floor pushes up on the ball as gravity pulls down the ball with an equal amount of force.

4

The gym floor pushes up on the ball with a greater amount of force than gravity pulls down on the ball.

7

media

8

media

9

media

10

media

11

Multiple Choice

If a runner covers a distance of 347 meters in 134 seconds, what is her speed?

1

2.59 m/s

2

46,498 m/s

3

0.39 m/s

4

6.78 m/s

12

Multiple Choice

What is the speed of a baseball that travels 49 meters in 2.4 seconds?

1

20.42 m/s

2

117.6 m/s

3

0.05 m/s

4

13.33 m/s

13

Multiple Choice

What is the velocity of a plane that traveled 3,000 miles from New York to California in 5.0 hours?

1

600 mi/hr west

2

600 mi/hr east

3

300 mi/hr west

4

300 mi/hr east

14

Multiple Choice

How long would it take for a car to travel a distance of 200 kilometers if it is traveling at a speed of 55 km/hr?

1

3.6 hours

2

44 hours

3

12.5 hours

4

90 hours

15

Multiple Choice

A plane traveled for about 2.5 hours at a speed of 1200 km/hr. How many kilometers did it fly?

1

3,000 km

2

480 km

3

310 km

4

900 km

16

Multiple Choice

An ant carries food at a speed of 1 cm/s. How many seconds will it take the ant to carry a cookie crumb from your kitchen table to its anthill, a distance of 50 m?

1

500 s

2

50 s

3

5,000 s

4

50,000 s

17

media

18

media

19

media

20

Match

Match the answer choices with the correct response.

Acceleration on a distance time graph shows up as a __________ line.

Speed on a distance time graph shows up as a straight __________ line.

No motion on a distance time graph shows up as a straight __________ line.

Deceleration on a distance time graph shows up as a __________ line.

curved upwards

diagonal

horizontal

curved downwards

21

Multiple Choice

Question image

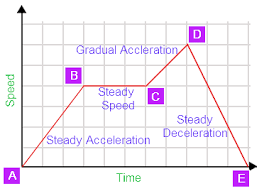
At what point is the speed the greatest?

1

C-D

2

B-C

3

A-B

4

D-E

22

Multiple Choice

Question image
What is this graph showing?
1
Constant Speed
2
Acceleration (speeding up)
3
Deceleration (slowing down)
4
No motion

23

Multiple Choice

Question image

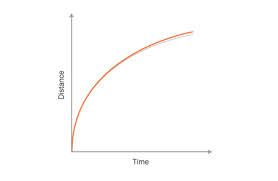
This graph shows an object is...

1

at constant speed

2

speeding up

3

slowing down

4

stopped

24

Multiple Choice

Question image
The picture of the position vs. time graph shows an object that is...
1
accelerating/speeding up
2
moving at a constant speed 
3
not moving 
4
accelerating/slowing down. 

25

Multiple Choice

Question image

In this distance time graph A shows

1

Constant speed

2

Acceleration

3

Distance

4

Stopped

26

Multiple Choice

Question image

In this distance time graph B shows

1

Constant speed

2

Acceleration

3

Stopped

4

Distance

27

Multiple Choice

Question image

In this distance time graph C shows

1

Constant speed

2

Acceleration

3

Stopped

4

Distance

28

Multiple Choice

Question image

In this distance time graph D shows

1

Constant speed returning to origin

2

Acceleration

3

Stopped

4

Distance

29

Multiple Choice

Question image
Which graph is showing deceleration (getting slower)
1
D
2
E
3
both D and E
4
neither D or E

30

Multiple Choice

Question image
Which runner stopped for a rest?
1
Albert
2
Bob
3
Charlie

31

media

32

media

33

media

34

media
media

Show answer

Auto Play

Slide 1 / 34

SLIDE