
Unit 5 Test Review
Presentation
•
Mathematics
•
9th - 12th Grade
•
Easy

Ilyse Marcinkiewicz
Used 1+ times
FREE Resource
6 Slides • 18 Questions
1
2
3
4

5


6
Hotspot
7
Match
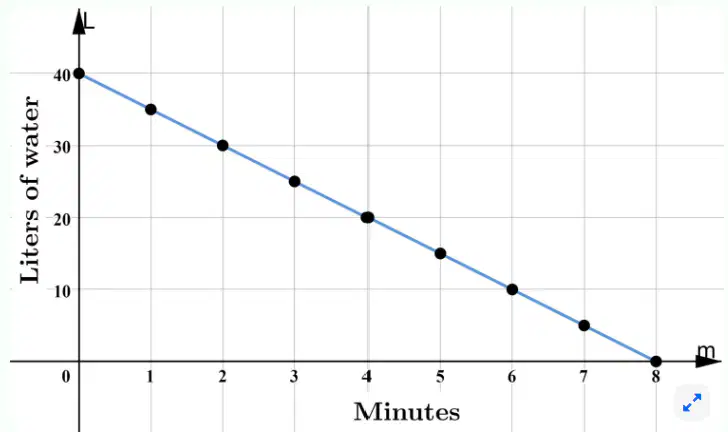
The graph represents how many liters of water a fish tank holds over the course of 8 minutes. Match the description with the correct term. At the beginning of the 8 minutes, the tank held 40 liters of water. At the end of the 8 minutes, the tank had 0 liters of water. After 4 minutes, the tank had 20 liters of water.
8
Multiple Choice

What y-values correspond to the given x-values?
Use the mapping list to fill in the table.
9
Dropdown
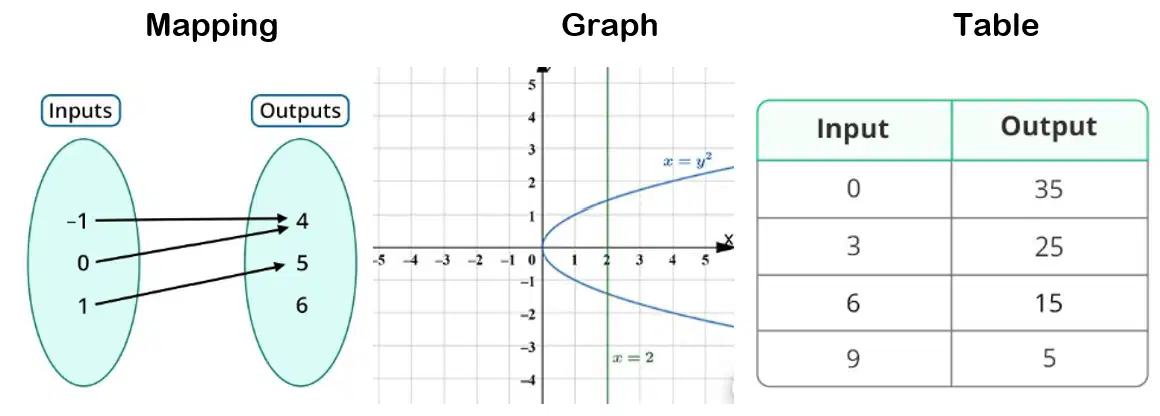
Mapping is
Graph is
Table is
10
Multiple Select

Which values are a part of the domain? Select all that apply.
11
Multiple Choice
12
Math Response
13
Hotspot
14
Hotspot
15
Multiple Select
16
Match
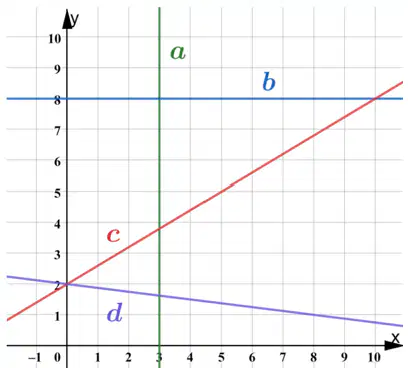
Match the lines to their slopes.
17
Draw
18
Multiple Choice
19
Match
20
Multiple Select
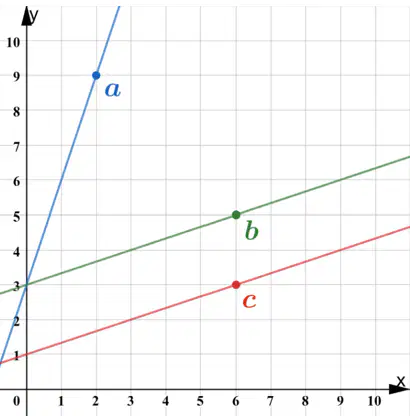
Which statements are true about the line pairs?
21
Multiple Choice
22
Match
23
Multiple Choice
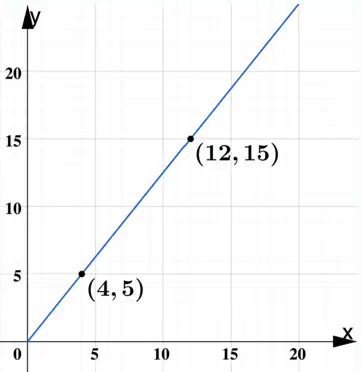
What is the constant of proportionality for the graph below?
24

Show answer
Auto Play
Slide 1 / 24
SLIDE
