
Inferences and Using Sample Data
Presentation
•
Mathematics
•
7th Grade
•
Practice Problem
•
Easy

Audra Bothers
Used 2+ times
FREE Resource
13 Slides • 22 Questions
1
2
3
4

5
Fill in the Blanks

Type answer...
6
Fill in the Blanks
Type answer...
7
8
Multiple Select

4) How do the distributions of the heights of each team compare? Choose all that apply.
9
10
Fill in the Blanks
Type answer...
11
Fill in the Blanks
Type answer...
12
Multiple Choice
8) Consider that the 10 players used for each team sample are only a portion of the players for each team.
a. Look at your box plots. What is the probability that a player on the basketball team is between 72 inches and 74 inches?
13
Multiple Choice
8) Consider that the 10 players used for each team sample are only a portion of the players for each team.
b. Look at your box plots. What is the probability that a player on the soccer team will be shorter than 63 inches?
14
Multiple Choice
8) Consider that the 10 players used for each team sample are only a portion of the players for each team.
c. Look at your box plots. Based on the sample data, what is the probability that a player on the basketball team has a height between 68 inches and 77 inches?
15
Poll
16
17
18

19
Match

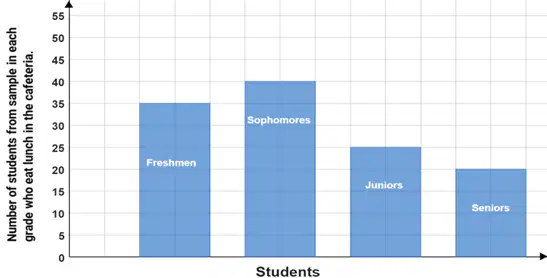
1) There are 1080 students at the high school.
a. From the sample, find the number of students in each class that eat lunch in the cafeteria.
20
Multiple Choice

1) There are 1080 students at the high school.
b. How many total students from the sample eat lunch in the cafeteria?
21
22
Fill in the Blanks
23
Multiple Select

2) Would it be appropriate to use the proportion of students that eat lunch in the cafeteria that are freshmen from the sample to determine the total number of students at the high school that eat lunch in the cafeteria? Choose all that apply.
24
Poll
25
Draw
26

27
28
29
Multiple Choice

The first person randomly chooses 2000 people from a list of people that live in the town and finds that 125 of them have had some type of accident over the past year.
30
Multiple Choice
The second person surveys 1500 people that are leaving the ER (emergency room) of a hospital and finds that 750 of them have had some type of accident over the past year.
31
Multiple Choice
The third person randomly selects a person entering a shopping mall, then chooses every 10th person afterwards that enters the mall, and finds that only 50 of the 1700 people sampled have had some type of accident.
32
Multiple Choice
The fourth person selects 1600 people from the town and asks them how serious of an injury they incurred when they had their accident.
33
Multiple Choice
The fifth person selects every 10th person to leave the town's grocery store, and surveys a total of 228 people.
34
Multiple Choice
The sixth person groups people by age, gender, and race. Then, they randomly select people from each subgroup so that the numbers are proportional to the population. They survey a total of 2,000 people.
35
Poll
Show answer
Auto Play
Slide 1 / 35
SLIDE
