
Check In 2 Review

Presentation
•
Mathematics
•
9th - 12th Grade
•
Practice Problem
•
Hard

Elzy Jay Lindsey
FREE Resource
26 Slides • 0 Questions
1
Check In 2 Practice
By Elzy Jay Lindsey
2
Graph of a quadratic
When you graph a quadratic. Say, for instance, a person is throwing a rock off a cliff into the ocean, and they want to know when the rock hits the water. It is the greater zero of the function. You must factor the quadratic and find the greater zero.

3
Domain of a function
The domain of a function are its x-values. Think of any values that COULD NOT be true for x. Could x be negative?

4
Exponential Growth
When determining exponential growth, you have to divide your percent by 100. So, if something is 1.2.% growth 1.2/100 = 0.012, then you add that decimal to 1, so the growth factor is 1.012

5
Non-routine problems
If you’re trying to find the SUM of x & y you add them, the difference is subtraction, the product is multiplication.
The sum of 2 numbers, x & y is 12, their difference is 2. What is their product?
6
Solving systems by elimination
Solving systems by elimination means adding the 2 equations together to remove the opposite coefficients. Then solve for the other variable.

7
Average with missing value
When you find the average and you’re missing a value use x for the missing value. Set up an equation were you’re adding the numbers and x = to the average. Divide both slides by the number of numbers (and x). Multiply the denominator away from both sides then add the numbers on the left. Finally subtract them from the average number(which you multiplied times the denominator)

8
Distance between zeros
The distance between the zeros of a function means how far apart on the x-axis are they? So factor the trinomial then see how far the 2 x’s are apart.

9
Systems by substitution
When you solve an equation by substitution but one equation still needs to be put in y=mx+b form. Put the equation that is closest to y=mx=b in that form then take the mx+b part and put that into the other equation in place of y. Solve for x.

10
Linear equations
Leo has a job selling t-shirts at the circus, he earns $15 per game plus $0.50 for each shirt he sells. How many shirts does he need to sell to make $25?
11
Equation from a table
Equation from a table the slope is how the y-values are changing. The y-intercept is what y is when x = 0.

12
Break-even point
The break even point is when the lines intersect (the solution to the system).

13
Polynomial arithmetic
Multiply the first trinomial times 3, then the second one times 5, then subtract the second from the first to solve 3f(x)-5g(x)
f(x)= 2x²+3x-5 g(x)= 6x²+7x-1
14
Difference in maximum values
Difference in maximum values in quadratics. Graph both in Desmos, maximum are the vertex in each. Count the spaces between the 2, if diagonal use distance formula.


15
Difference between y-intercepts
Difference between 2 y-intercepts. First equation is line through 2 points do a linear regression (y1~mx1+b), graph the second and count the space between the 2 y-intercepts.
The graph of a linear function passes through the points (2, 7) & (4, 12)
A second linear function is y=-2x +6. What is the difference between their y-intercepts?
16
Exponential decay
Percent decrease is subtracted from 1, so if the equation is
y =30(0.75)x the percent decrease is -0.25 or 25% off.
The original price is $30 (the y-intercept). And the sale price is 75% of what it USED TO BE or 25% OFF (1 - 0.25 = 0.75).
17
Range of a function
Domain are the x-values that is 3 -10, plug those into the equation to get the OUTPUTS that is the range.

18
Exponential functions
y=a(b)x
a=initial amount
b=growth factor
x=number of times (years)

19
Changing dimensions
If I double the length and width what happens to the area?

20
Domain of a function
What are the possible x-values of this function?

21
Equations vs. tables
Drop both into Desmos. If you need to find any info from a table, do y1~mx1+b and get all the regression data (m= slope, b= y-int, r = correlation coefficient, e1 plots residuals). If you need to compare slopes or intercepts just use this info.
*** Remember, you can plot points by putting them into a table and doing a regression to make a line and get all this valuable info.
22
Polynomial word problem
Area of shaded region outside of another rectangle (binomial side lengths)
Inside (w=x, l = 2x)
Outside (w=x+2, l =2x+3)


23
Linear model
A family purchased a television 4 years ago. 3 years ago it was worth $430. Last year it was worth $340. How much did they originally pay?
If you want to figure this out, make a table with the points (1, 430) and (2, 340). The numbers one ans 2 stand for the number of years they have owned the TV. so, when they owned the TV one year it was worth 430, and when they owned it for 2 years it was worth 340.
Do a linear regression between the 2 points to get the y-intercept (the initial price of the TV).
24
Systems by graphing
Plug into Desmos.
Remember to check for the exact answer they are asking for...
are they asking for the solution?
the x-value?
the y-value?

25
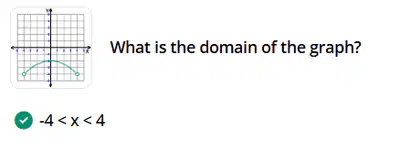
Domain
Domain are the x-values of a function. Which values could be TRUE for x?
26
Growth/decay factors
Remember that these are the b values in y=a(b)x.
You must take the percent and divide by 100 to get the decimal amount of growth or decay, than ADD or SUBTRACT this value from 1.

Check In 2 Practice
By Elzy Jay Lindsey
Show answer
Auto Play
Slide 1 / 26
SLIDE
Similar Resources on Wayground

19 questions
Writing Exponential Functions
Presentation
•
9th - 12th Grade
19 questions
Equations of Exponential Functions
Presentation
•
9th - 12th Grade
22 questions
Experimental vs. Observational Studies
Presentation
•
9th - 12th Grade
18 questions
Rational and Radical Expressions
Presentation
•
9th - 12th Grade
18 questions
Simplifying Square Roots
Presentation
•
9th - 12th Grade
19 questions
One and Two Step Equations REVIEW LESSON
Presentation
•
9th - 12th Grade
21 questions
Radical Equations Notes
Presentation
•
9th - 12th Grade
21 questions
Area of Circles and Sectors and Segments
Presentation
•
9th - 12th Grade
Popular Resources on Wayground
20 questions
Math Review

Quiz
•
3rd Grade
15 questions
Fast food
Quiz
•
7th Grade
20 questions
Context Clues
Quiz
•
6th Grade
20 questions
Inferences
Quiz
•
4th Grade
19 questions
Classifying Quadrilaterals
Quiz
•
3rd Grade
20 questions
Figurative Language Review
Quiz
•
6th Grade
20 questions
Equivalent Fractions
Quiz
•
3rd Grade
10 questions
Identify Fractions, Mixed Numbers & Improper Fractions
Quiz
•
3rd - 4th Grade
Discover more resources for Mathematics
10 questions
Test Your Knowledge with 15 Fun Trivia Questions

Interactive video
•
6th - 10th Grade
21 questions
Factoring Trinomials (a=1)
Quiz
•
9th Grade
25 questions
Final Exam Review
Quiz
•
8th - 9th Grade
23 questions
Cumulative Vocabulary Practice
Quiz
•
9th - 11th Grade
25 questions
Complementary and Supplementary Angles
Quiz
•
7th - 10th Grade
21 questions
Quadratic Unit Review
Quiz
•
9th Grade
31 questions
IM1: Naming <'s, Transform. & Tri Congruence Final Review #3
Quiz
•
9th - 10th Grade
30 questions
Geometry Semester 2 Final
Quiz
•
10th Grade