
1.5 Algebra 2-use graphs and tables to approximate solutions
Presentation
•
Mathematics
•
9th - 12th Grade
•
Hard
+17
Standards-aligned

Andreea GrigorieGal
Used 12+ times
FREE Resource
31 Slides • 32 Questions
1
Multiple Choice
2
Multiple Select

How would you describe your current mood?
3
Multiple Select

Which activity would you prefer to do right now?
4

5
6

7
8

9
Multiple Choice
10
Multiple Choice
11

12

13
Multiple Choice

What is the x-intercept of the graph?
14
Multiple Choice

What is the y-intercept?
15
Multiple Choice

What is the x-intercept?
16
Multiple Choice

What is the y-intercept?
17

18

19

20
Multiple Choice
21
Multiple Choice

Find the slope
22
Multiple Choice
23
Multiple Choice

Which is the graph of y=-x+2?
24
Multiple Choice
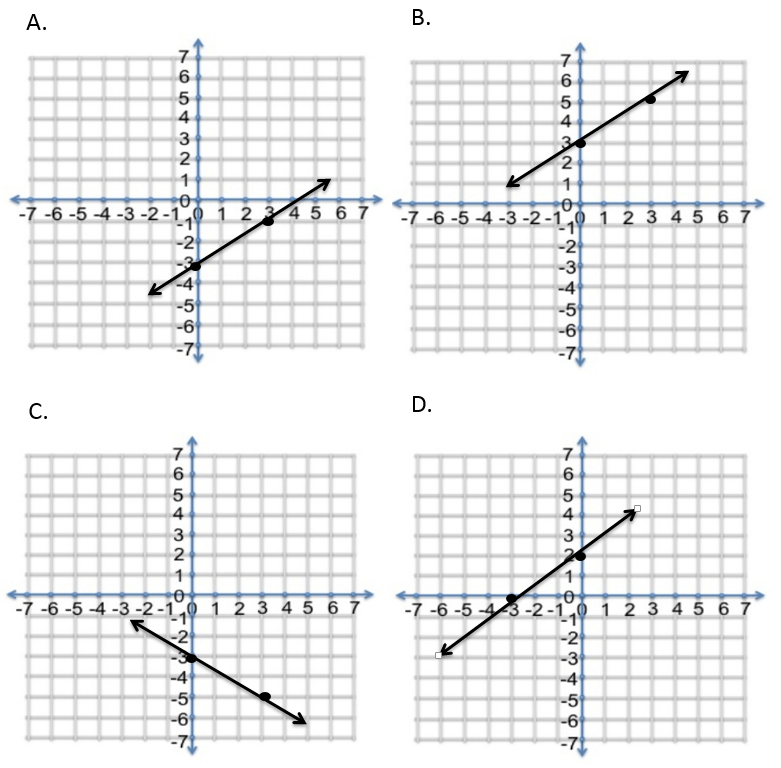
Graph. y = 2/3x - 3
25
Multiple Choice
Do Now- Day 2
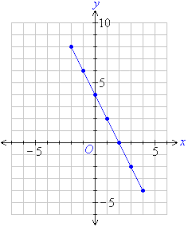
Give the equation for the graph
26
Multiple Select
How would you describe your current mood?
27
28

29
30

31

32

33
Multiple Choice
34

35
Multiple Choice
36

37
Open Ended
38
Multiple Choice
39

40

41
Multiple Choice
42

43

44
Fill in the Blank
45
Multiple Choice
46

47
Multiple Choice
48

49

50
Multiple Select
51
Open Ended
52

53
Fill in the Blank
54

55
Multiple Choice
56

57

58
Multiple Choice
59

60
Open Ended
61

62
Open Ended
63
Open Ended
Show answer
Auto Play
Slide 1 / 63
MULTIPLE CHOICE
