Search Header Logo
  1. Resource Library
  2. Science
  3. Physics
  4. Kinematics
  5. Student Copy Of One Dimensional Kinematics (motion Diagrams)
Student Copy of One Dimensional Kinematics (Motion Diagrams)

Student Copy of One Dimensional Kinematics (Motion Diagrams)

Assessment

Presentation

Science

11th Grade

Medium

NGSS
MS-PS3-1

Standards-aligned

Created by

Leonardo Montoya

Used 3+ times

FREE Resource

13 Slides • 17 Questions

1

media

2

Multiple Choice

Which of the following best describes the significance of studying kinematic motion and graphs in understanding physical phenomena?

1

They help us visualize and analyze how objects move over time.

2

They are only used for artistic representations of motion.

3

They are mainly used in chemistry, not physics.

4

They are not useful for understanding real-world motion.

3

media

4

media

5

Multiple Choice

Question image

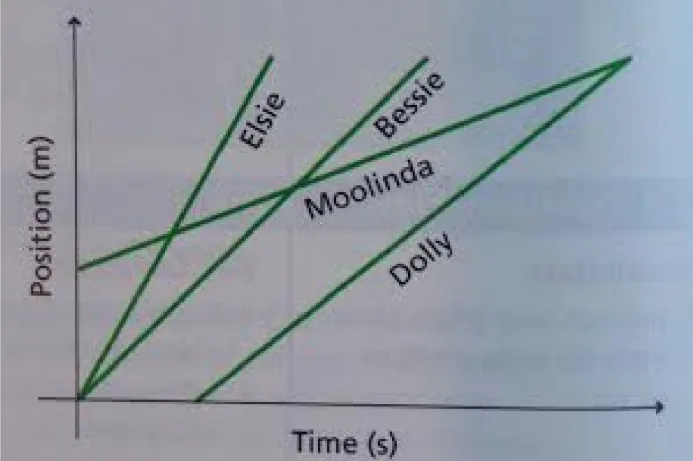
Rank the cows (Elsie, Bessie, Dolly, and Moolinda) from fastest to slowest based on the position vs. time graph.

1

Elsie, Bessie, Dolly, Moolinda

2

Bessie, Elsie, Moolinda, Dolly

3

Dolly, Moolinda, Bessie, Elsie

4

Moolinda, Dolly, Elsie, Bessie

6

media

7

Multiple Choice

On a distance vs. time graph, what does the slope of the line represent?

1

Speed

2

Acceleration

3

Distance

4

Time

8

Multiple Choice

Question image
Which line represents an object moving at a faster speed?
1
A
2
B

9

media

10

media

11

Open Ended

Explain how you can determine if an object is not moving by looking at a distance vs. time graph.

12

Hotspot

Which of the following points shows an object speeding up?

13

media

14

Match

Question image

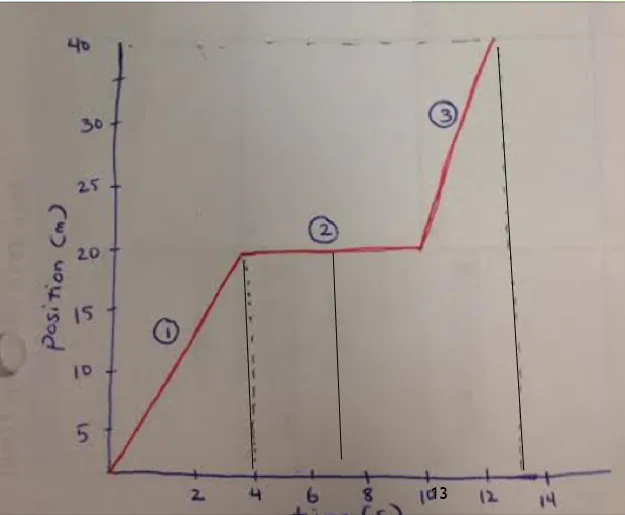
Match the section to its speed.

1

2

3

Fastest Speed

Slowest Speed

No Motion

15

Math Response

How fast did Jim run for the 2nd Interval?

(Just provide the answer)

Type answer here
Deg°
Rad

16

Math Response

How fast did Jim run for the 3rd Interval?

(Just provide the answer)

Type answer here
Deg°
Rad

17

Math Response

What was Jim's average velocity during his run, based on the position vs. time graph? (Just provide the number)

Type answer here
Deg°
Rad

18

media

19

media

20

Draw

1) A man slowly walks out of his house with his dog for 4 seconds.

2) The dog stops to use the bathroom next to the fire hydrant and does his business for another 6 seconds.

3) Soon after, the dog sees a squirrel and sprints after it. The man sprints after the dog for the next 2 seconds.

4) The man stops the dog and scolds him for 2 seconds.

5) After getting strange looks from everyone, he realizes that he doesn’t have a dog so he starts to jog back home with his jump rope. This takes him 4 seconds.

21

media

22

media

23

Draw

1) An ant slowly sneaks into a grasshopper’s hut and finds his way to the central office in 6 seconds.

2) A giant grasshopper spots the ant and chases the ant out of the hut. The grasshopper continues to chase him out into the wilderness, which takes a total of 4 seconds.

3) The grasshopper catches the ant and leaves him buried in the ground forever.

24

media

25

Math Response

Jim walked 10 m down the school hallway, from the cafeteria to the band room. Cindy, who has developed an interest in Jim, records his position every 2 s and notes that he moved 2.6 m every 2 s. At what time was Jim in the following position:

3 m from the cafeteria?

Type answer here
Deg°
Rad

26

Math Response

Jim walked 10 m down the school hallway, from the cafeteria to the band room. Cindy, who has developed an interest in Jim, records his position every 2 s and notes that he moved 2.6 m every 2 s. At what time was Jim in the following position:

3 m from the band room?

Type answer here
Deg°
Rad

27

Draw

Jim walked 10 m down the school hallway, from the cafeteria to the band room. Cindy, who has developed an interest in Jim, records his position every 2 s and notes that he moved 2.6 m every 2 s.

28

media

29

Multiple Choice

How confident do you feel about interpreting motion graphs to determine speed, velocity, and acceleration after this lesson?

1

Very confident

2

Somewhat confident

3

Not very confident

4

Not confident at all

30

Multiple Choice

Based on the position vs. time graph shown, what is the average velocity of Jim during segment 6 (from t = 8 s to t = 12 s)?

1

-1.76 m/s

2

0 m/s

3

2.5 m/s

4

1.25 m/s

media

Show answer

Auto Play

Slide 1 / 30

SLIDE