

Analyng Geographic Data: The Americas

Presentation
•
Geography
•
6th Grade
•
Practice Problem
•
Hard

Karen Gonzalez
FREE Resource
20 Slides • 21 Questions
1

2
Multiple Choice
What important information does geographic data provide for understanding natural disasters?
Occurrence
Impact
Response
All of the above
3
4
Multiple Choice
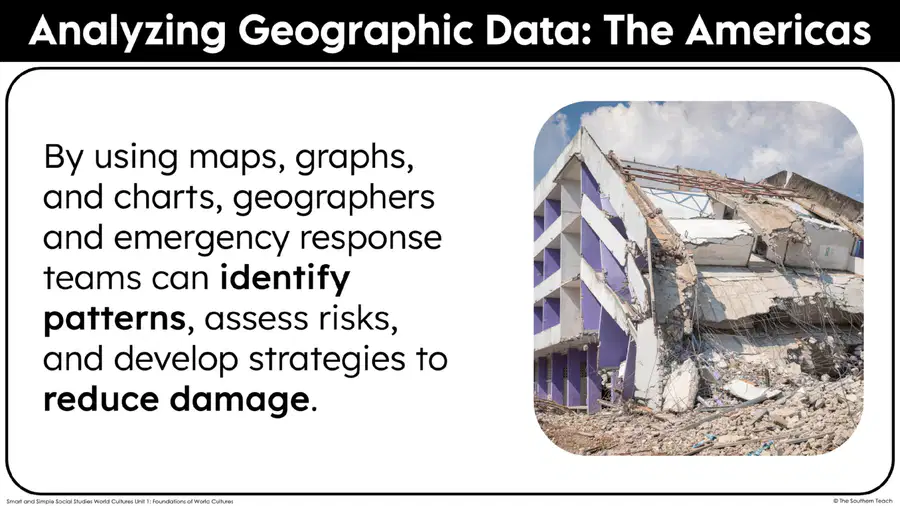
What can geographers and emergency response teams identify by using maps, graphs, and charts?
Patterns
Colors
Shapes
Sizes
5
6
Open Ended
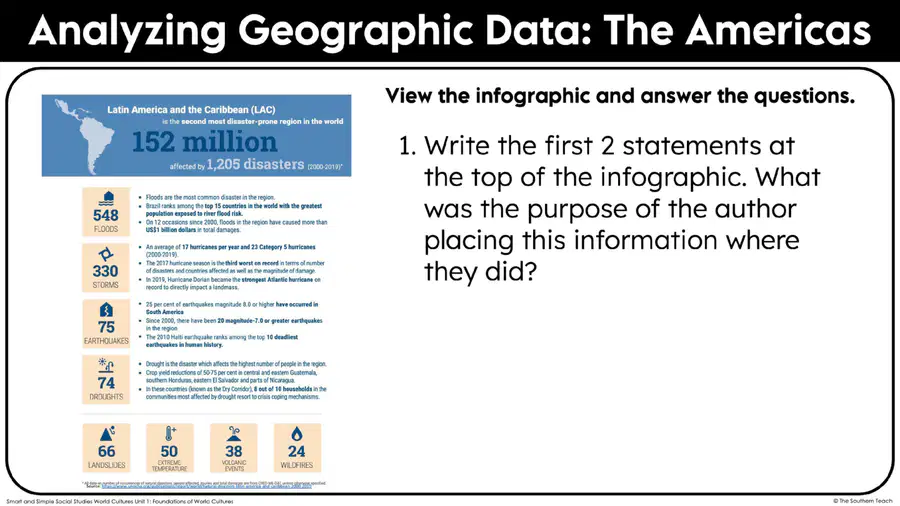
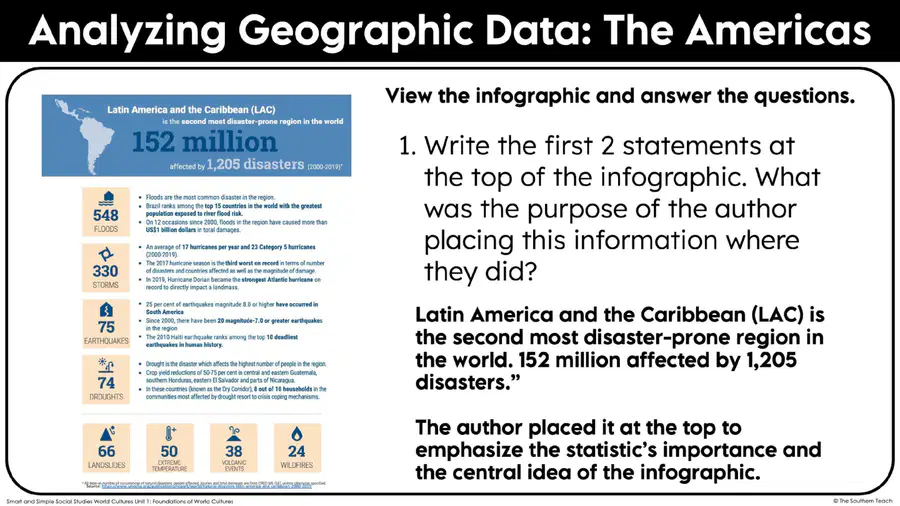
What was the purpose of the author placing the first 2 statements in the title of the infographic?
7
Multiple Choice
Which type of natural disaster is NOT common to this region?
earthquakes
volcanic eruptions
tornados
hurricanes
8
9
Multiple Choice
What is the significance of the statistic that Latin America and the Caribbean (LAC) is the second most disaster-prone region in the world, with 152 million affected by 1,205 disasters?
To highlight the frequency of disasters
To emphasize the impact on population
To compare with other regions
To suggest solutions for disaster management
10
11
Multiple Choice
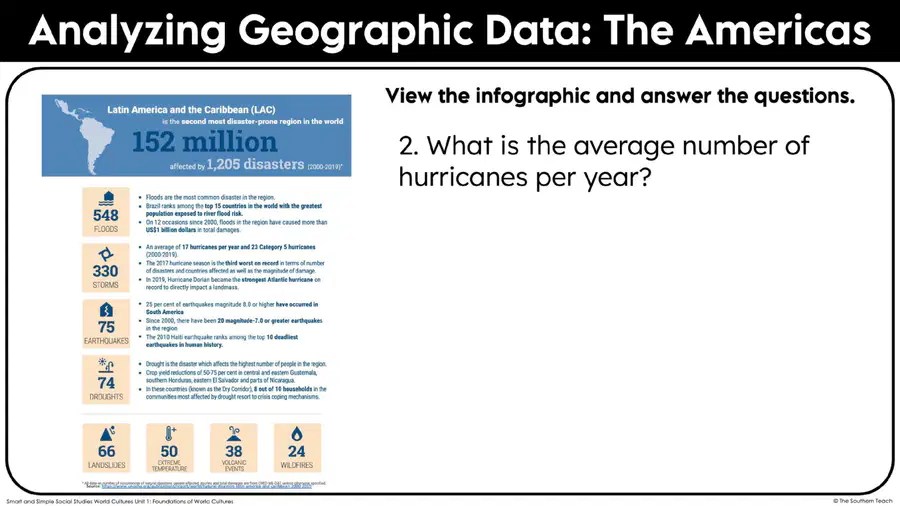
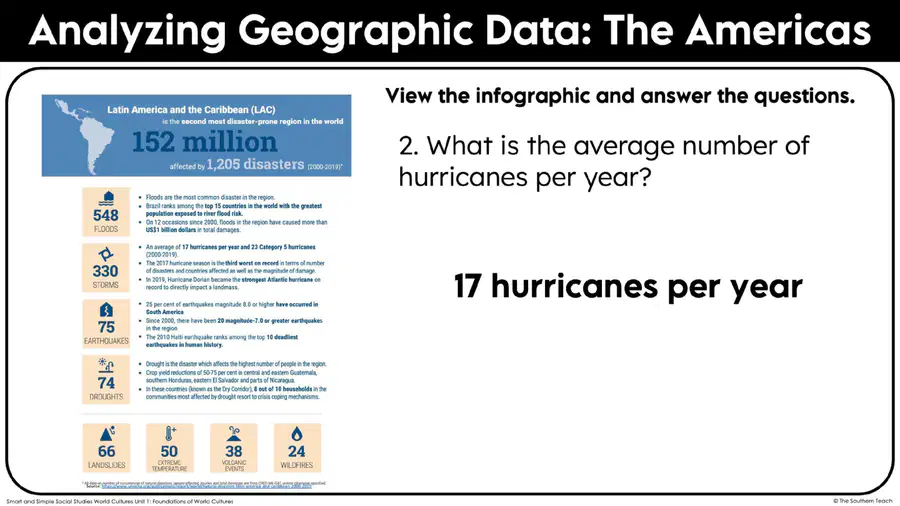
What is the average number of hurricanes per year?
10
17
20
25
12
13
14
Multiple Choice
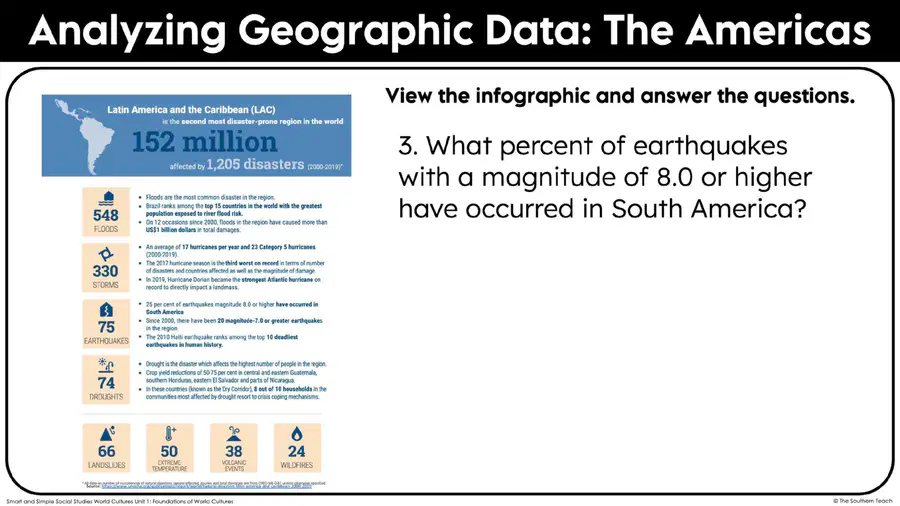
What percent of earthquakes with a magnitude of 8.0 or higher have occurred in South America?
10%
15%
20%
25%
15
16
Open Ended
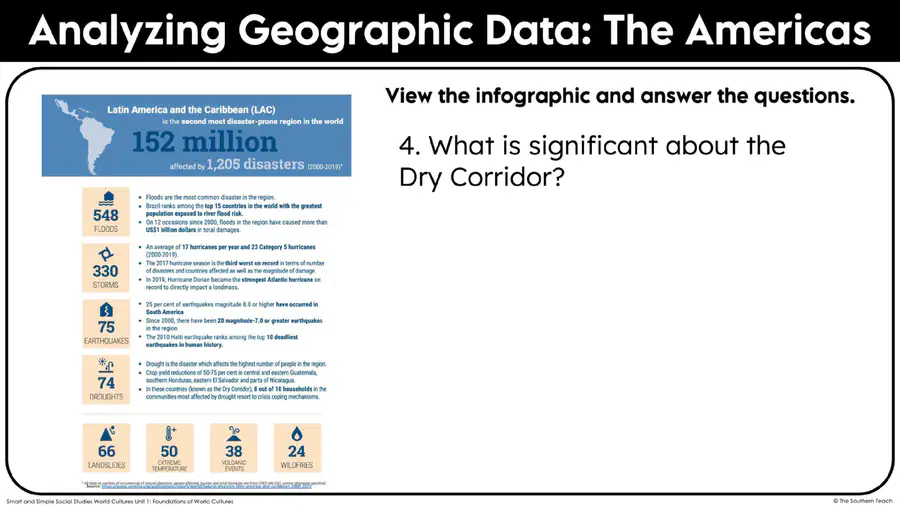
What is significant about the Dry Corridor?
17
Fill in the Blanks
18
19
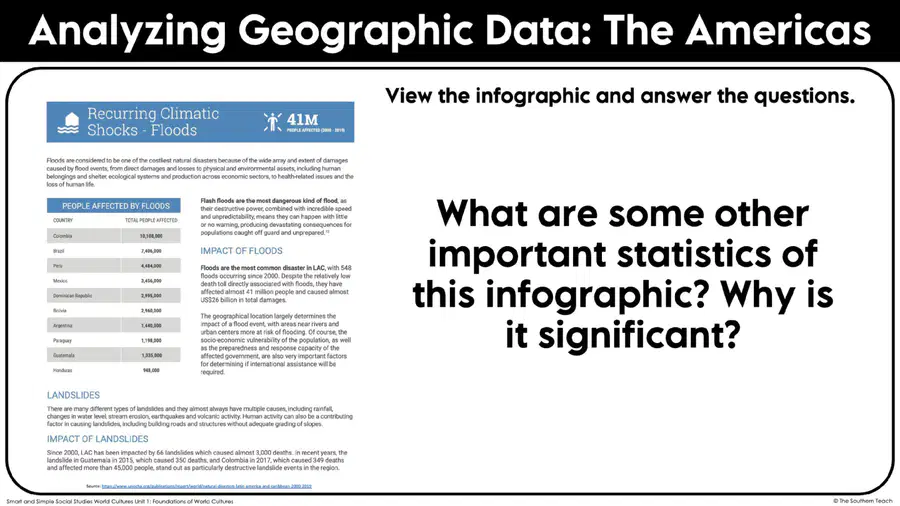
Open Ended
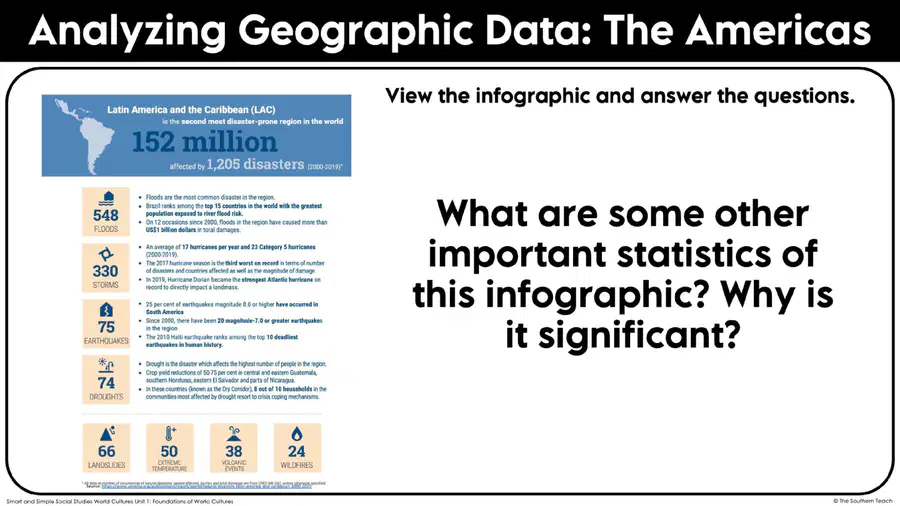
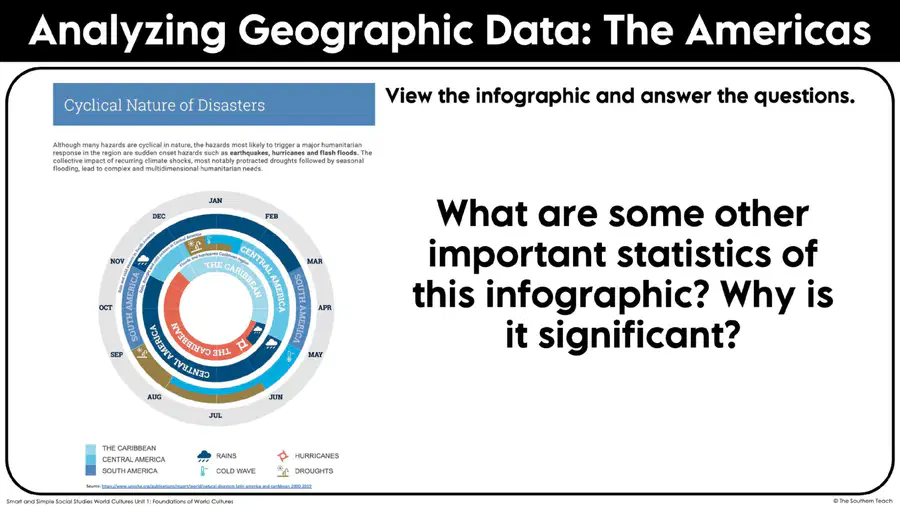
What are some other important statistics of this infographic? Why is it significant?
20
21
Open Ended
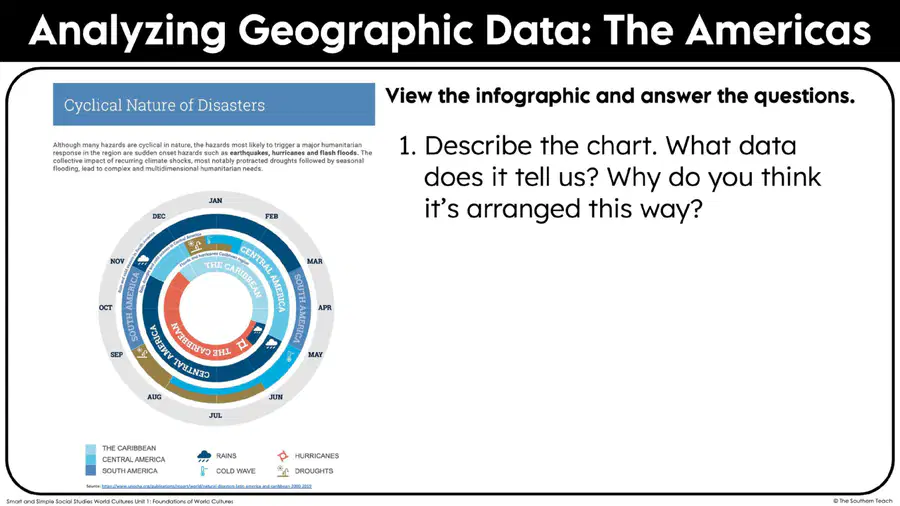
Describe the chart. What data does it tell us? Why do you think it’s arranged this way?
22
23
Multiple Choice
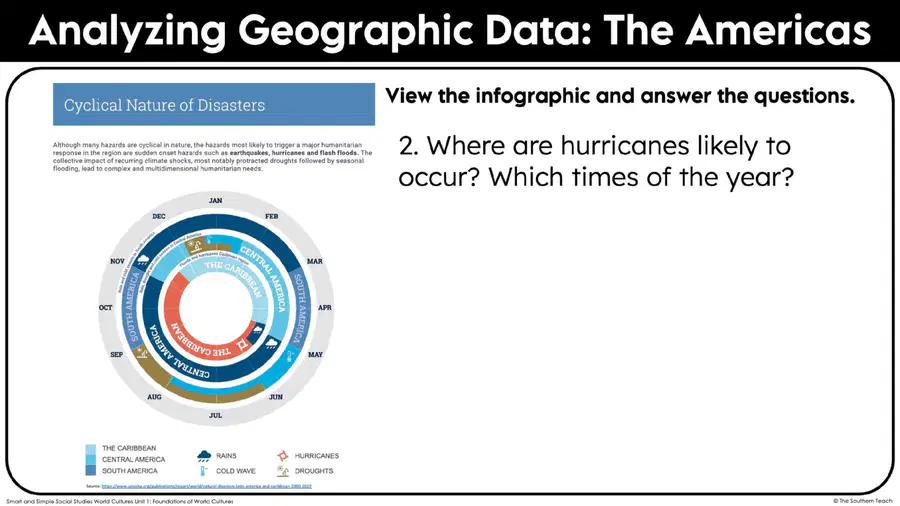
Where are hurricanes likely to occur?
The Caribbean
Central America
South America
North America
24
25
Multiple Choice
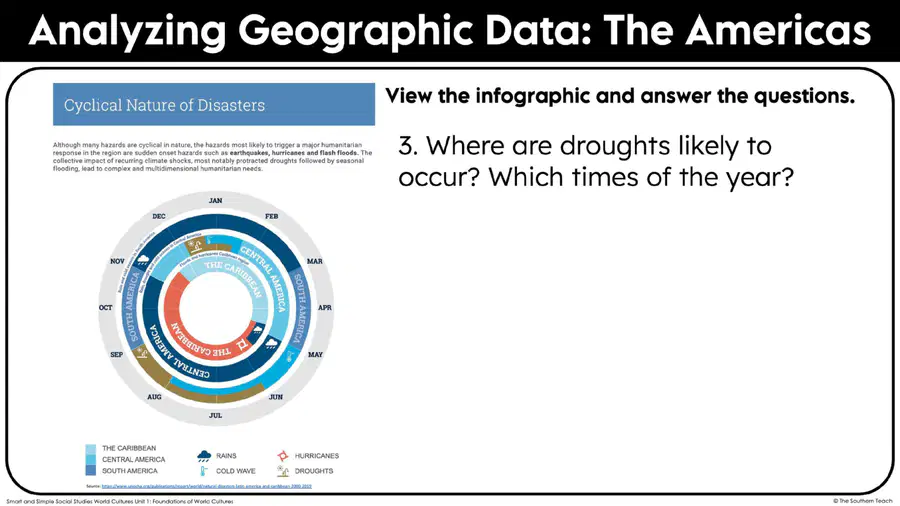
Where are droughts likely to occur?
Central America
South America
The Caribbean
All of the above
26
Multiple Choice
What is a critical aspect of applying data analysis in geography according to the text?
Using only global scale models
Interpreting statistical data with precision
Ignoring the limitations of data sources
Focusing solely on numerical data
27
28
Open Ended
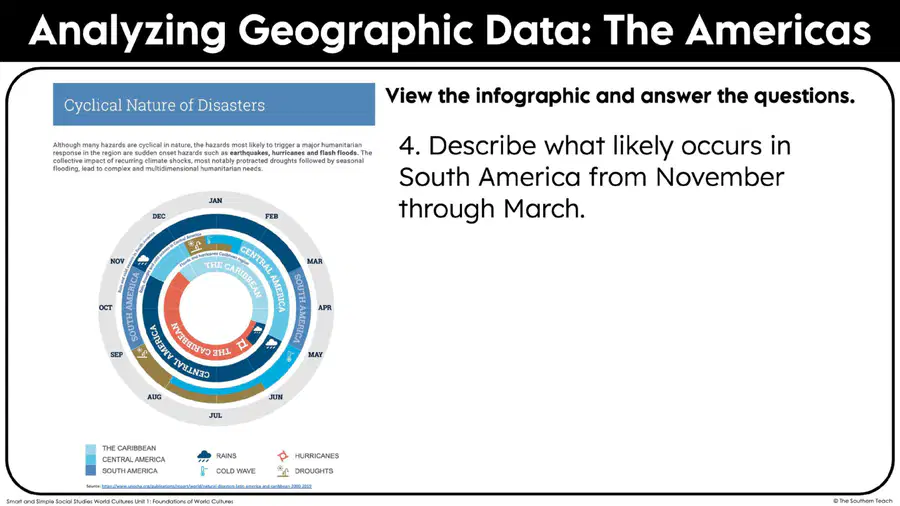
Describe what likely occurs in South America from November through March.
29
Multiple Choice
This is the part of year when the temperatures are warm enough for plants to grow.
Summer Season
Growing Season
Winter Season
Spring Season
30
Fill in the Blanks
31
32
33
Open Ended
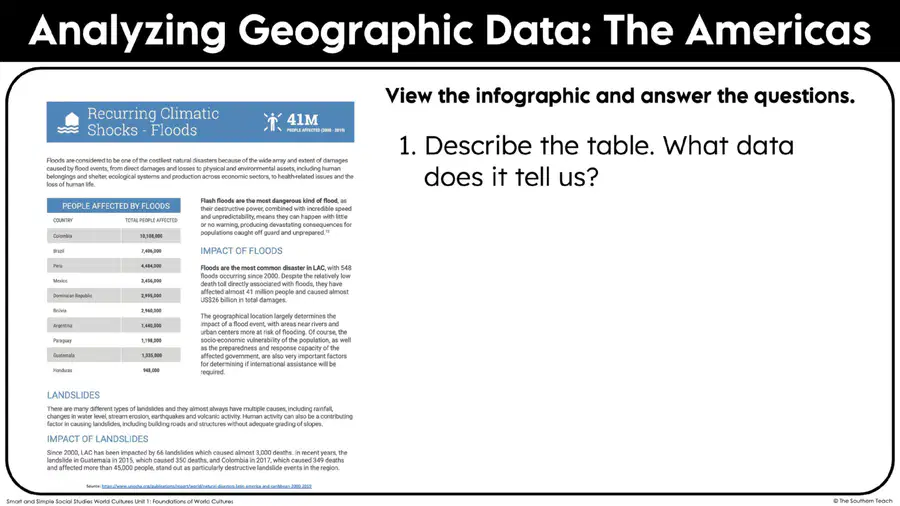
Describe the table. What data does it tell us?
34
35
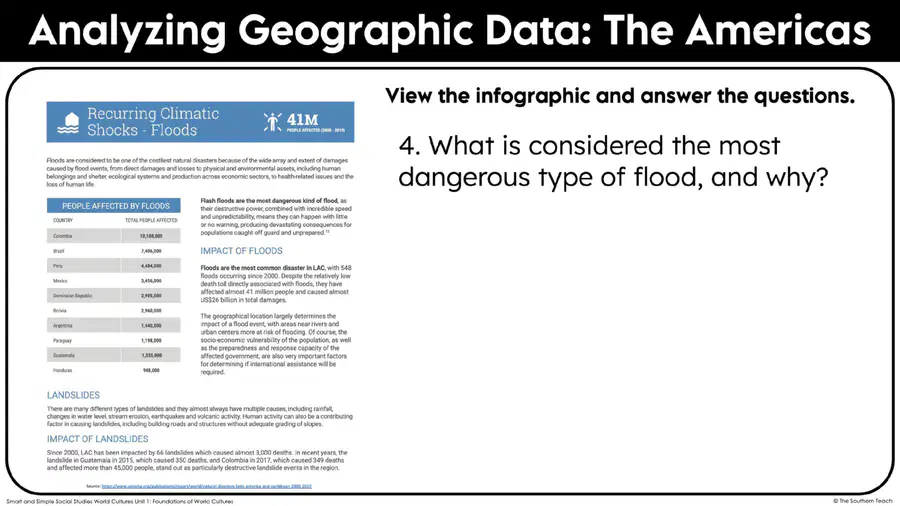
Multiple Choice
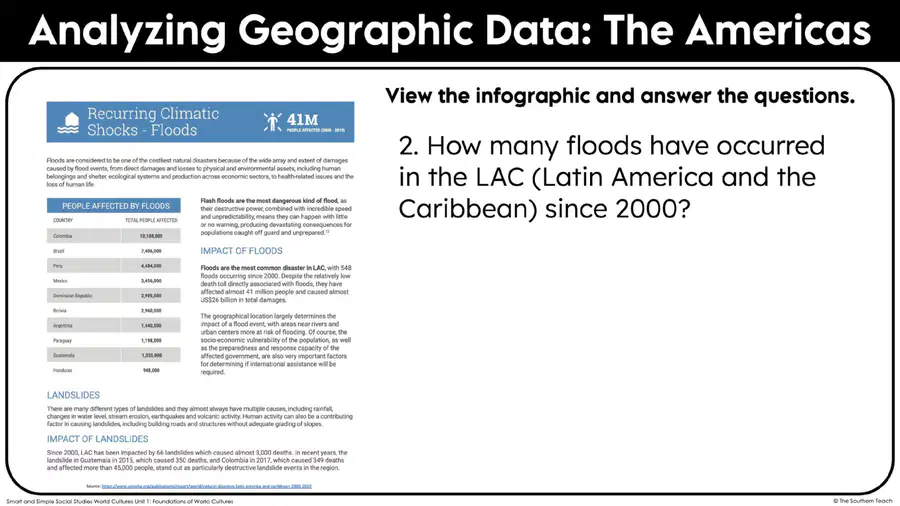
How many floods have occurred in the LAC (Latin America and the Caribbean) since 2000?
548
350
41M
3,000
36
37
Multiple Choice
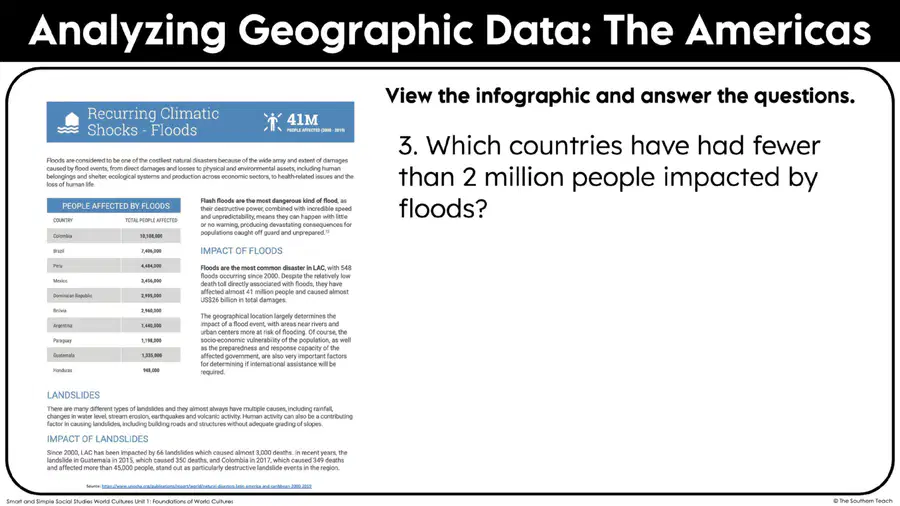
Which countries have had fewer than 2 million people impacted by floods?
Argentina
Paraguay
Guatemala
Honduras
38
39
40
41
Poll
How confident do you feel about this topic now?
Show answer
Auto Play
Slide 1 / 41
SLIDE
Similar Resources on Wayground

37 questions
Potential and Kinetic Energy Guided Lesson
Presentation
•
6th Grade
36 questions
Figurative Language
Presentation
•
6th Grade
36 questions
Levels of Organization - Cells to Biome
Presentation
•
KG
33 questions
ENERGY TRANSFORMATION
Presentation
•
6th Grade
40 questions
Environmental Issues - East and Southeast Asia
Presentation
•
6th Grade
35 questions
Nonfiction
Presentation
•
6th Grade
35 questions
The Silk Road
Presentation
•
6th Grade
38 questions
Temperature, Salinity, and Density
Presentation
•
6th Grade
Popular Resources on Wayground
11 questions
Hallway & Bathroom Expectations

Quiz
•
6th - 8th Grade
10 questions
HCS SCI 03 Summer School Assessment 2
Quiz
•
3rd Grade
11 questions
Home Scope
Quiz
•
7th - 8th Grade
12 questions
2026 TAP Technology in the Classroom
Presentation
•
Professional Development
15 questions
HCS SCI 05 Summer School Assessment 2 Review
Quiz
•
5th Grade
15 questions
HCS SCI 04 Summer School Review 2
Quiz
•
4th Grade
59 questions
Geometry Unit 3 Review
Quiz
•
9th - 12th Grade
14 questions
FAST ELA READING SMAPLE TEST MATERIALS

Passage
•
3rd Grade