- Resource Library
- Math
- Probability And Statistics
- Shapes Of Distributions
- Decoding Data: What Shapes Can Tell Us!

Decoding Data: What Shapes Can Tell Us!
Presentation
•
Mathematics
•
9th - 12th Grade
•
Hard
+6
Standards-aligned

Joe Duncan
FREE Resource
10 Slides • 25 Questions
1

2
Open Ended
3

4
Multiple Choice
5

6
Multiple Choice
7

8
Multiple Choice
9

10
Open Ended
11

12
Multiple Choice
13

14
Multiple Choice
15

16
Fill in the Blanks
17

18

19
Open Ended
20
Multiple Choice
21
Fill in the Blanks
22
Multiple Choice

23
Multiple Choice
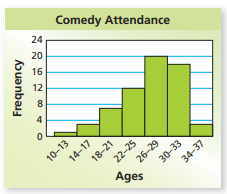
What is the shape of the data?
24
Multiple Choice

What is the shape of the data?
25
Multiple Choice

26
Multiple Choice

27
Multiple Choice

28
Multiple Choice

29
Multiple Choice

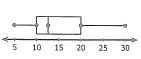
Which is a true statement based on the dot plots above?
30
Multiple Select

At Donald's Donuts the number of donut holes in a bag can vary. Help Donald find what happens when he purchases another bag with 15 in the bag. (Check all that are true)
12,10,13,12,11, 10
31
Multiple Choice
32
Multiple Choice
33
Multiple Choice
34
Multiple Choice
35
Open Ended
Show answer
Auto Play
Slide 1 / 35
SLIDE
