Search Header Logo
ELD9-12 - ELPAC Present and Discuss

ELD9-12 - ELPAC Present and Discuss

Assessment

Presentation

English

7th Grade

Practice Problem

Easy

CCSS
RI.7.7, 3.MD.B.3, 2.MD.D.10

+5

Standards-aligned

Created by

Josue Duarte

Used 4+ times

FREE Resource

14 Slides • 10 Questions

1
media

2

media

3

media

4

media

5

media

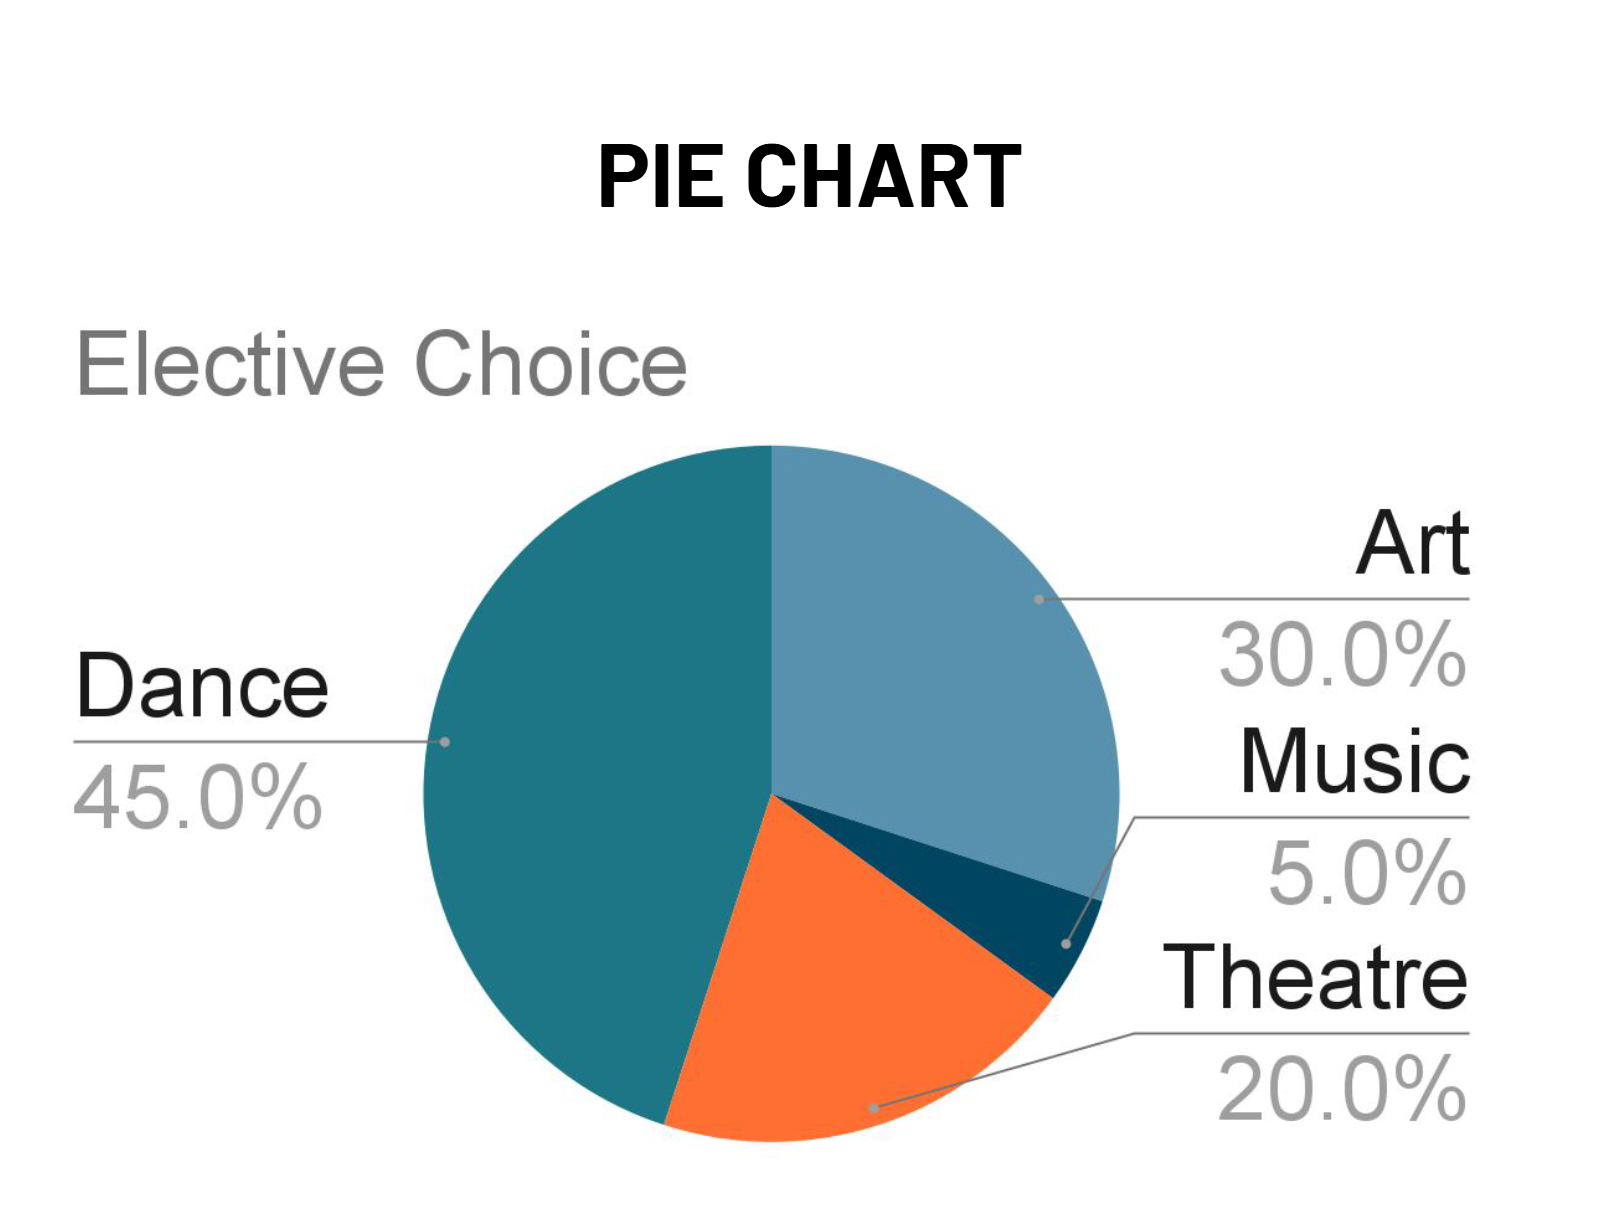
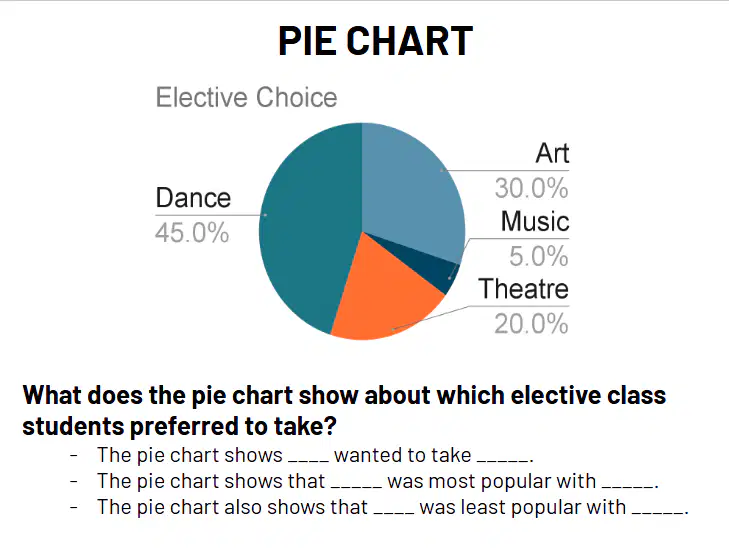
​Pie Chart

6

media

7

Fill in the Blanks

media image

8

Multiple Choice

Question image

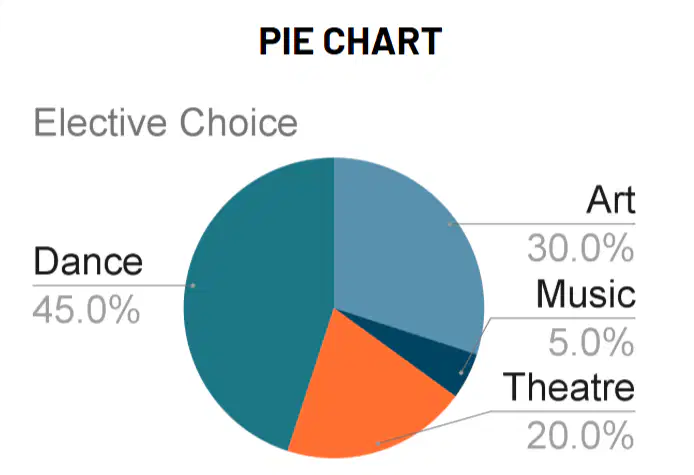
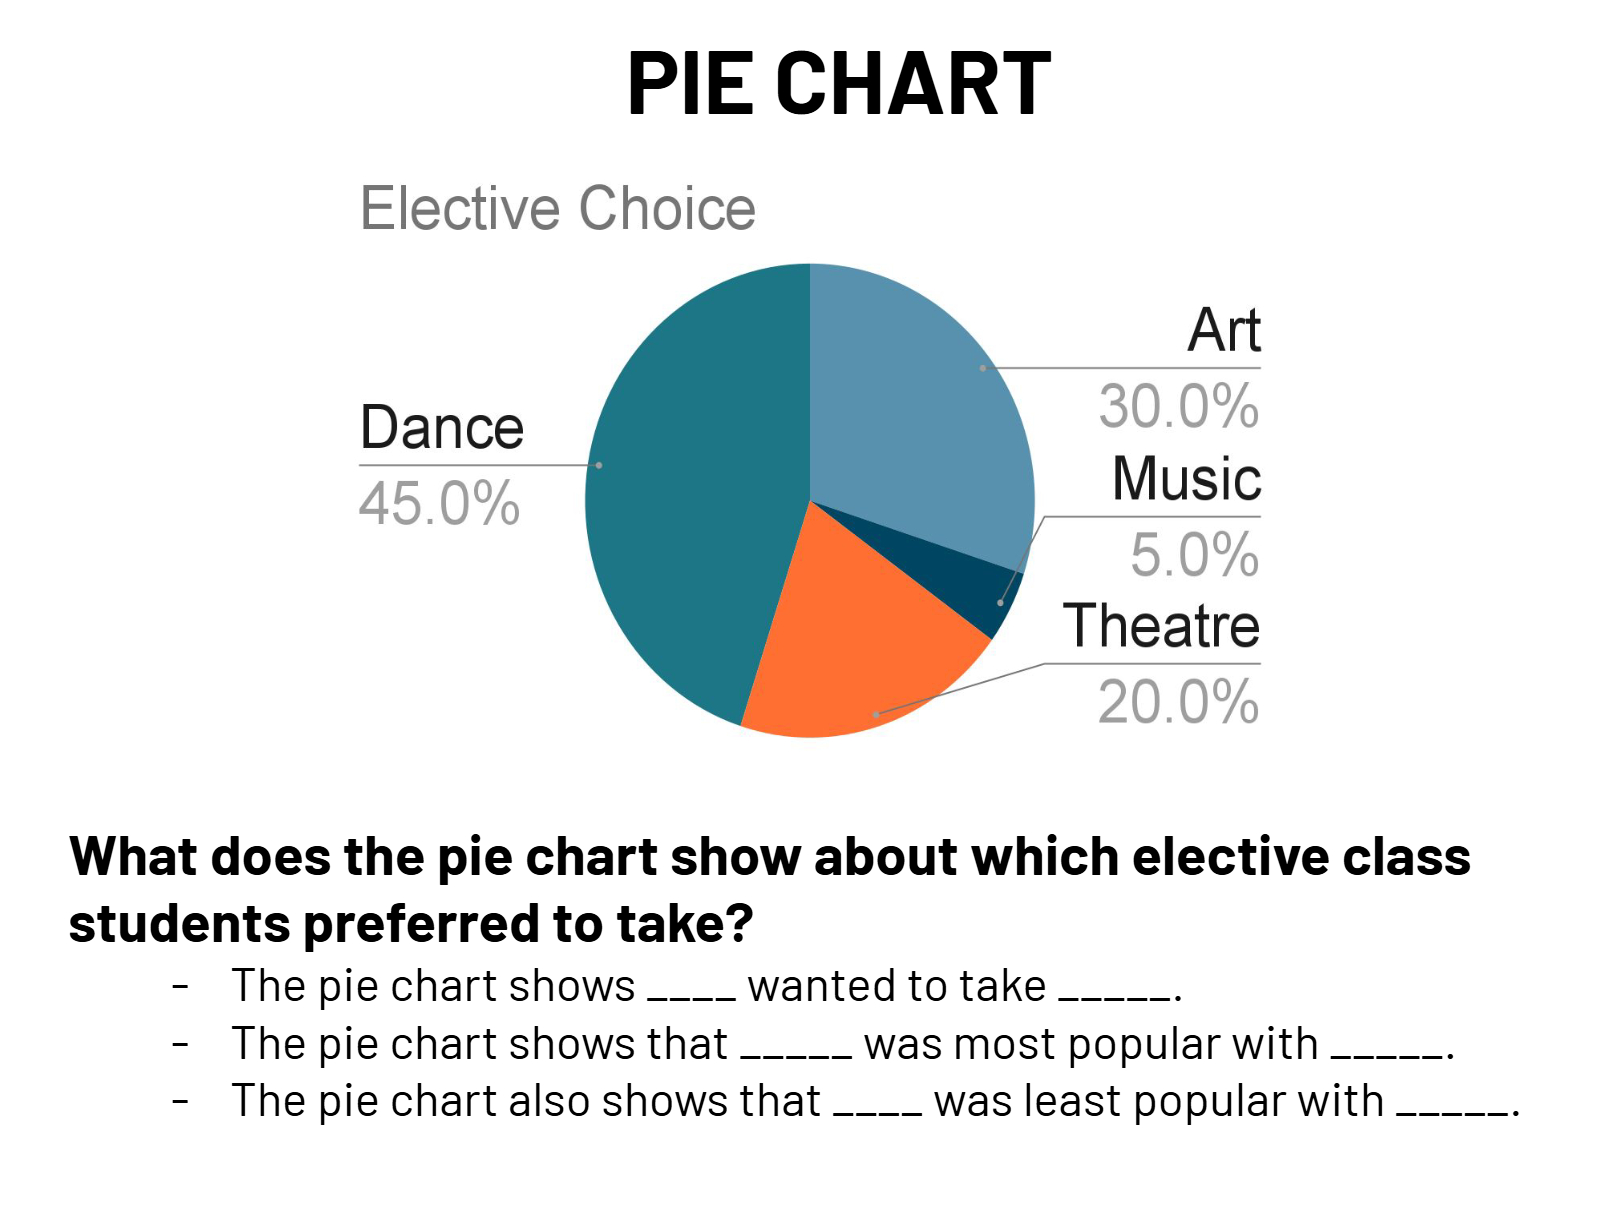
Based on the pie chart, which elective choice was the least popular among students?

1

Art

2

Dance

3

Music

4

Theatre

9

media

10

media

11

Multiple Select

Question image

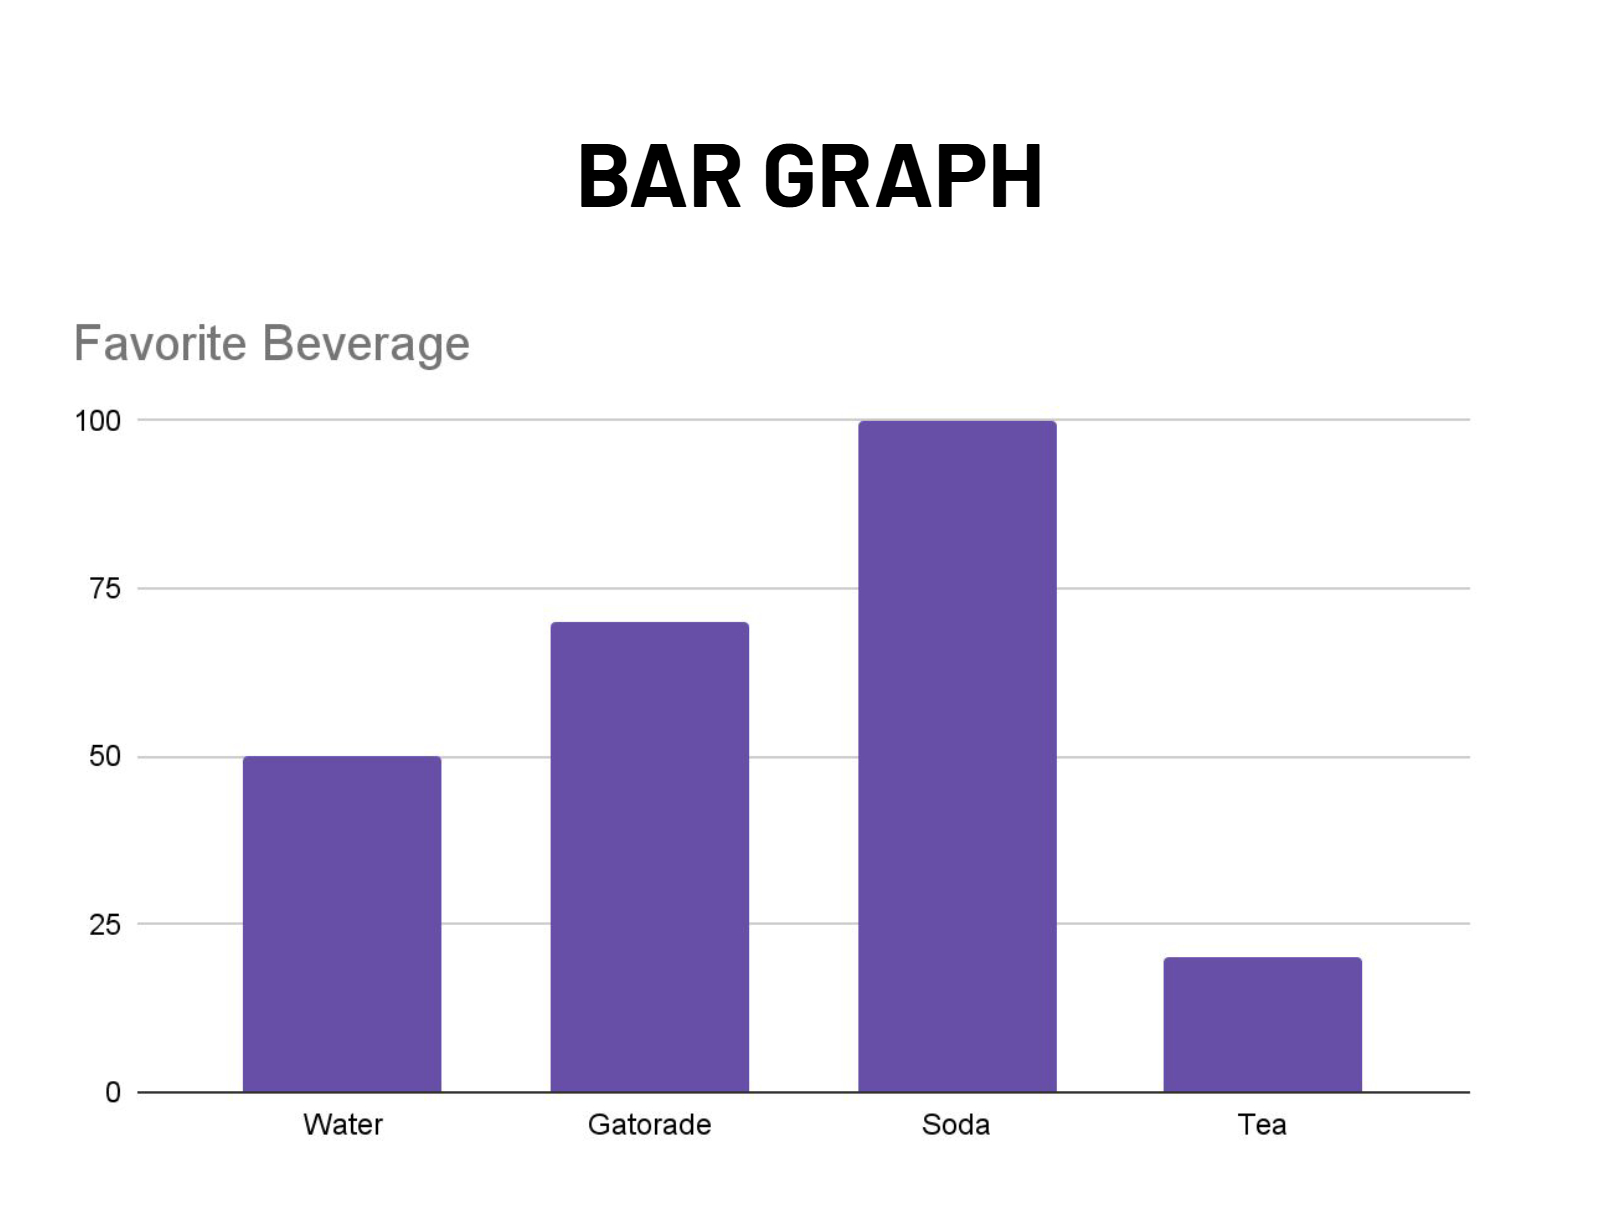
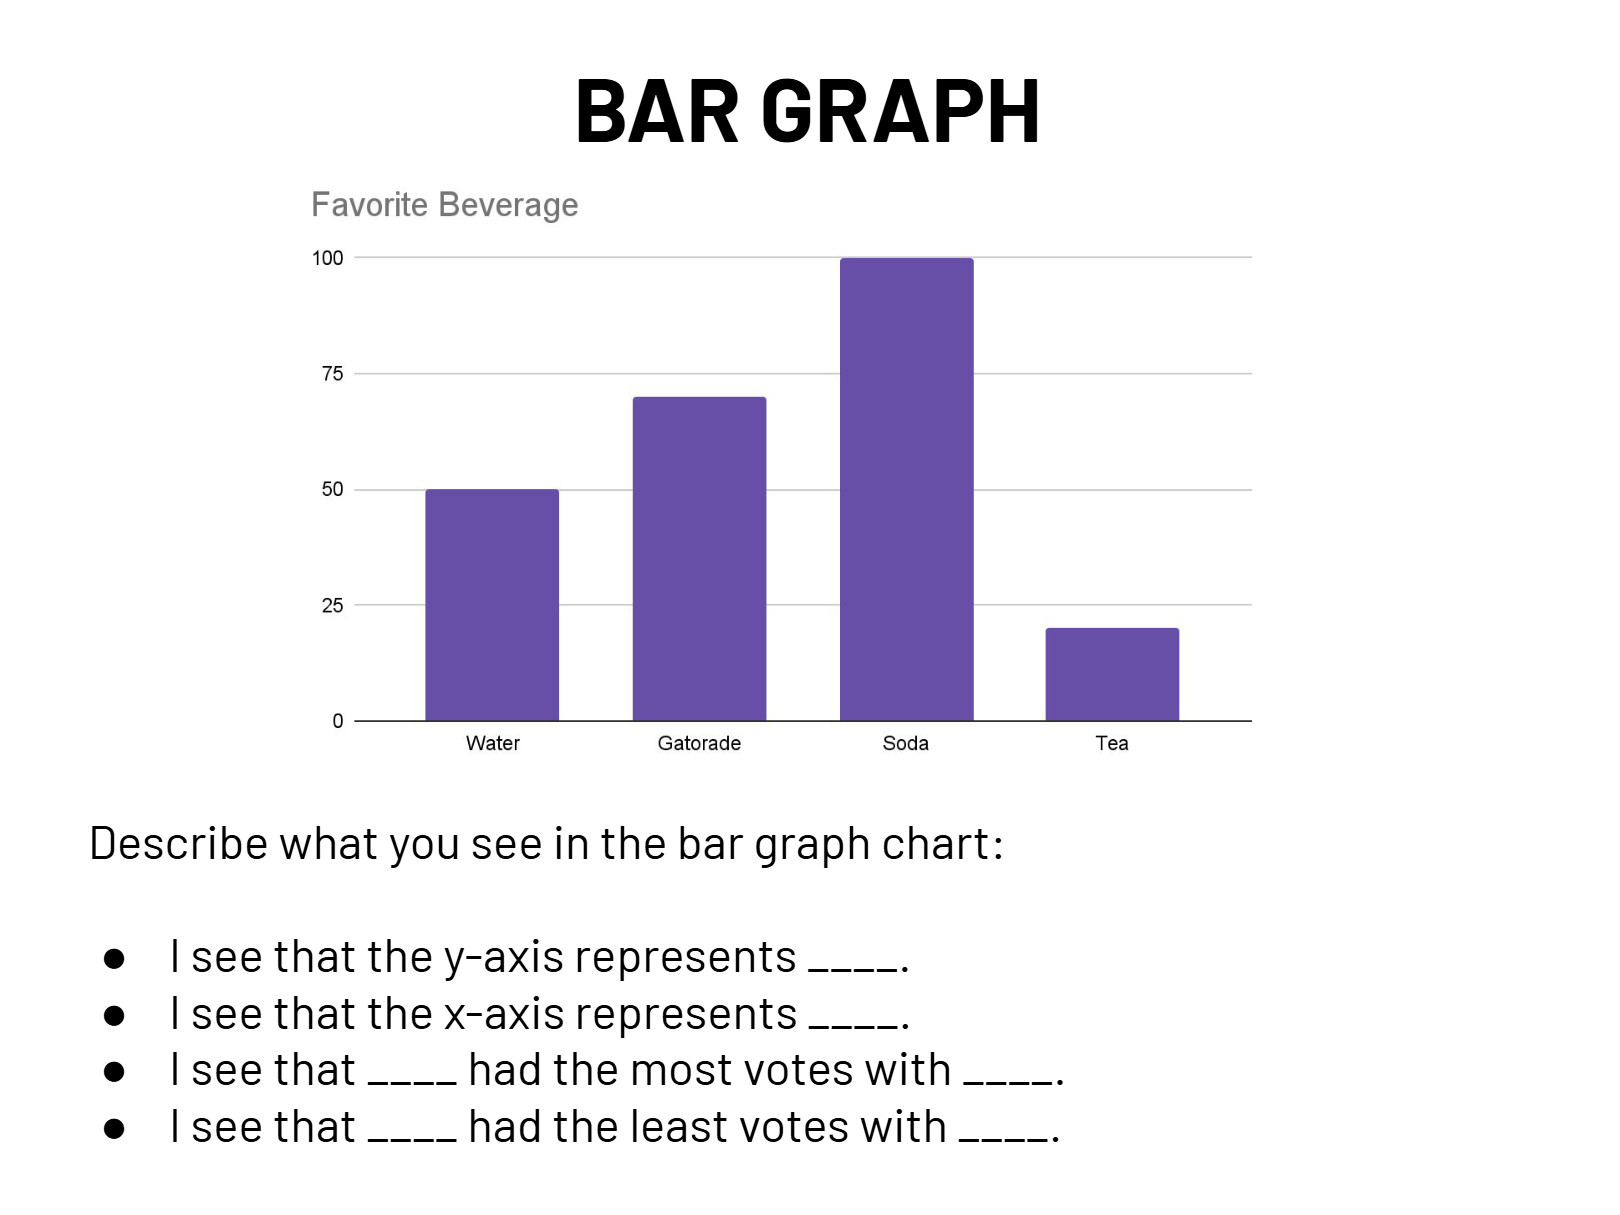
Which beverages are preferred by more than 60 students according to the bar graph?

1

Water

2

Gatorade

3

Soda

4

Tea

12

media

13

media

14

Multiple Choice

Question image

What percentage of students chose Dance as their elective according to the pie chart?

1

45%

2

30%

3

20%

4

5%

15

Dropdown

The pie chart shows that
was least popular with ​​

16

media

17

Multiple Choice

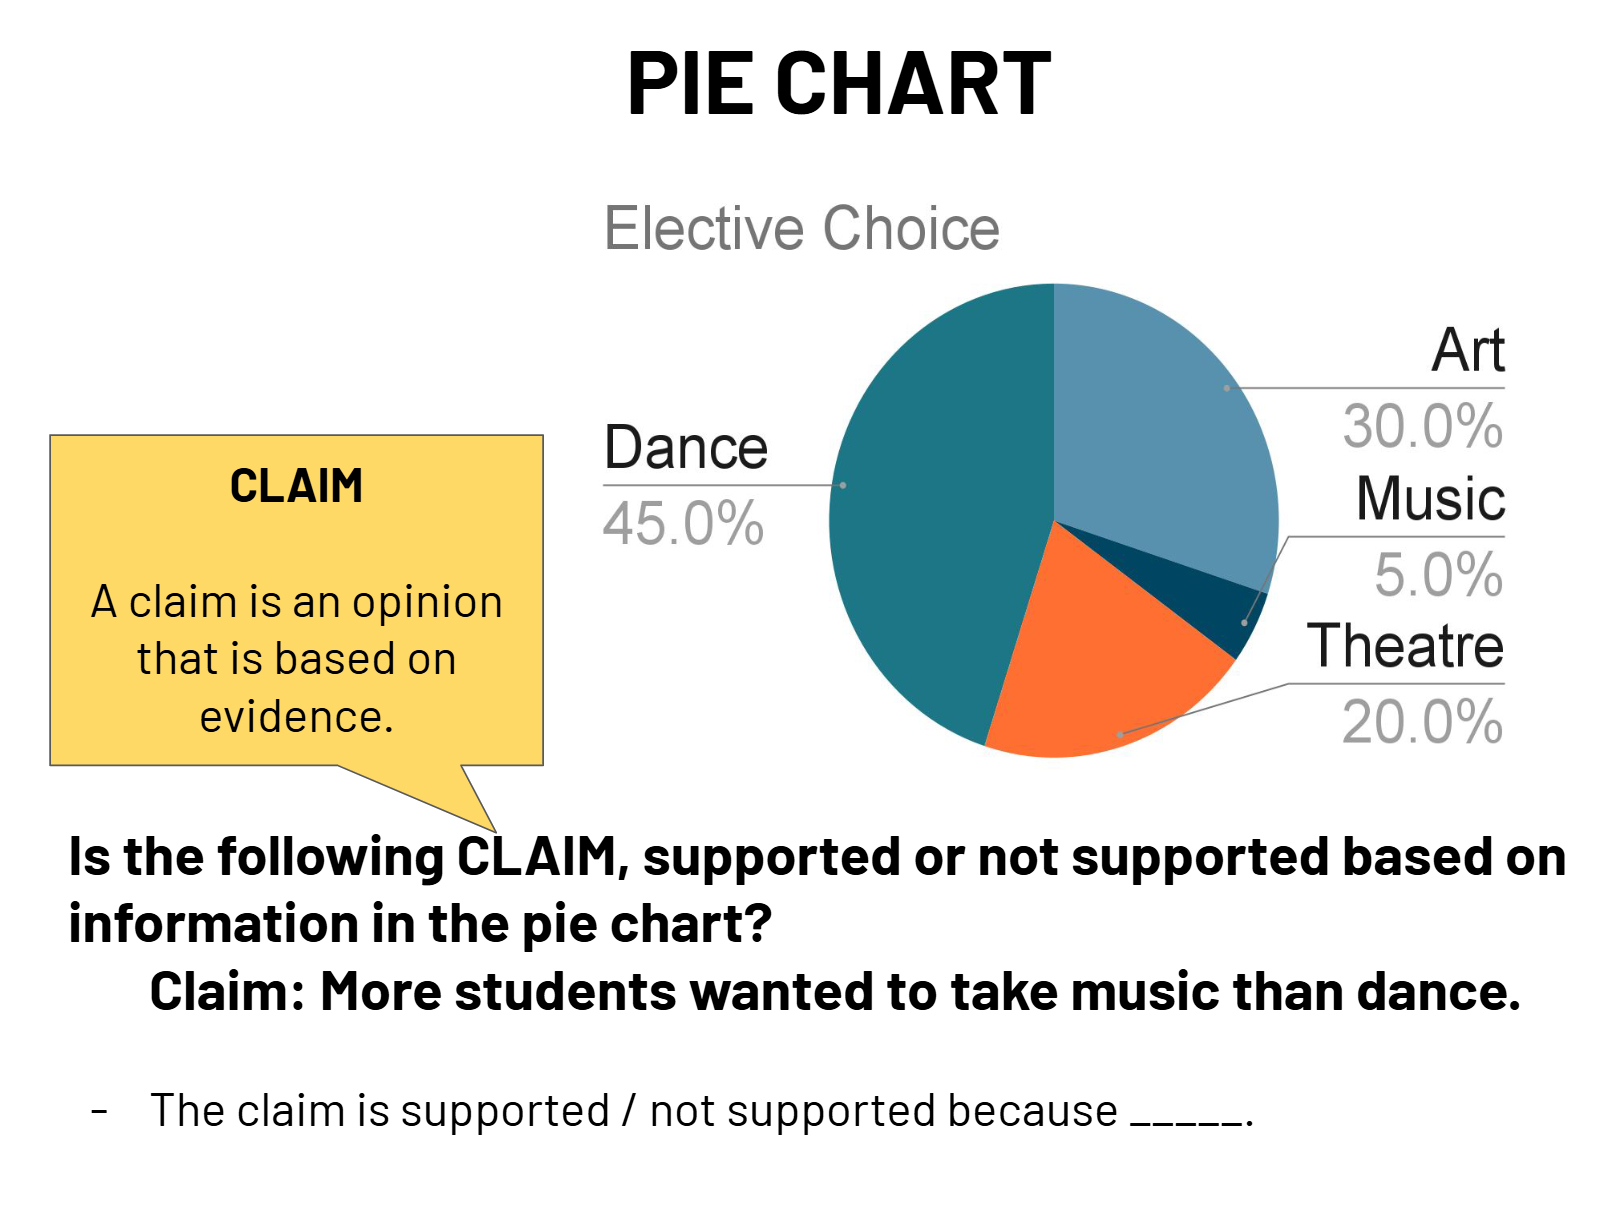
Is the following CLAIM, supported or not supported based on information in the pie chart? Claim: More students wanted to take music than dance. The claim is supported / not supported because _____.

1
not supported because the pie chart shows more students chose Dance than Music.
2

is supported because the pie chart shows more students chose music than dance.

3

nott supported because the pie chart shows both are popular.

18

media

19

Open Ended

Question image

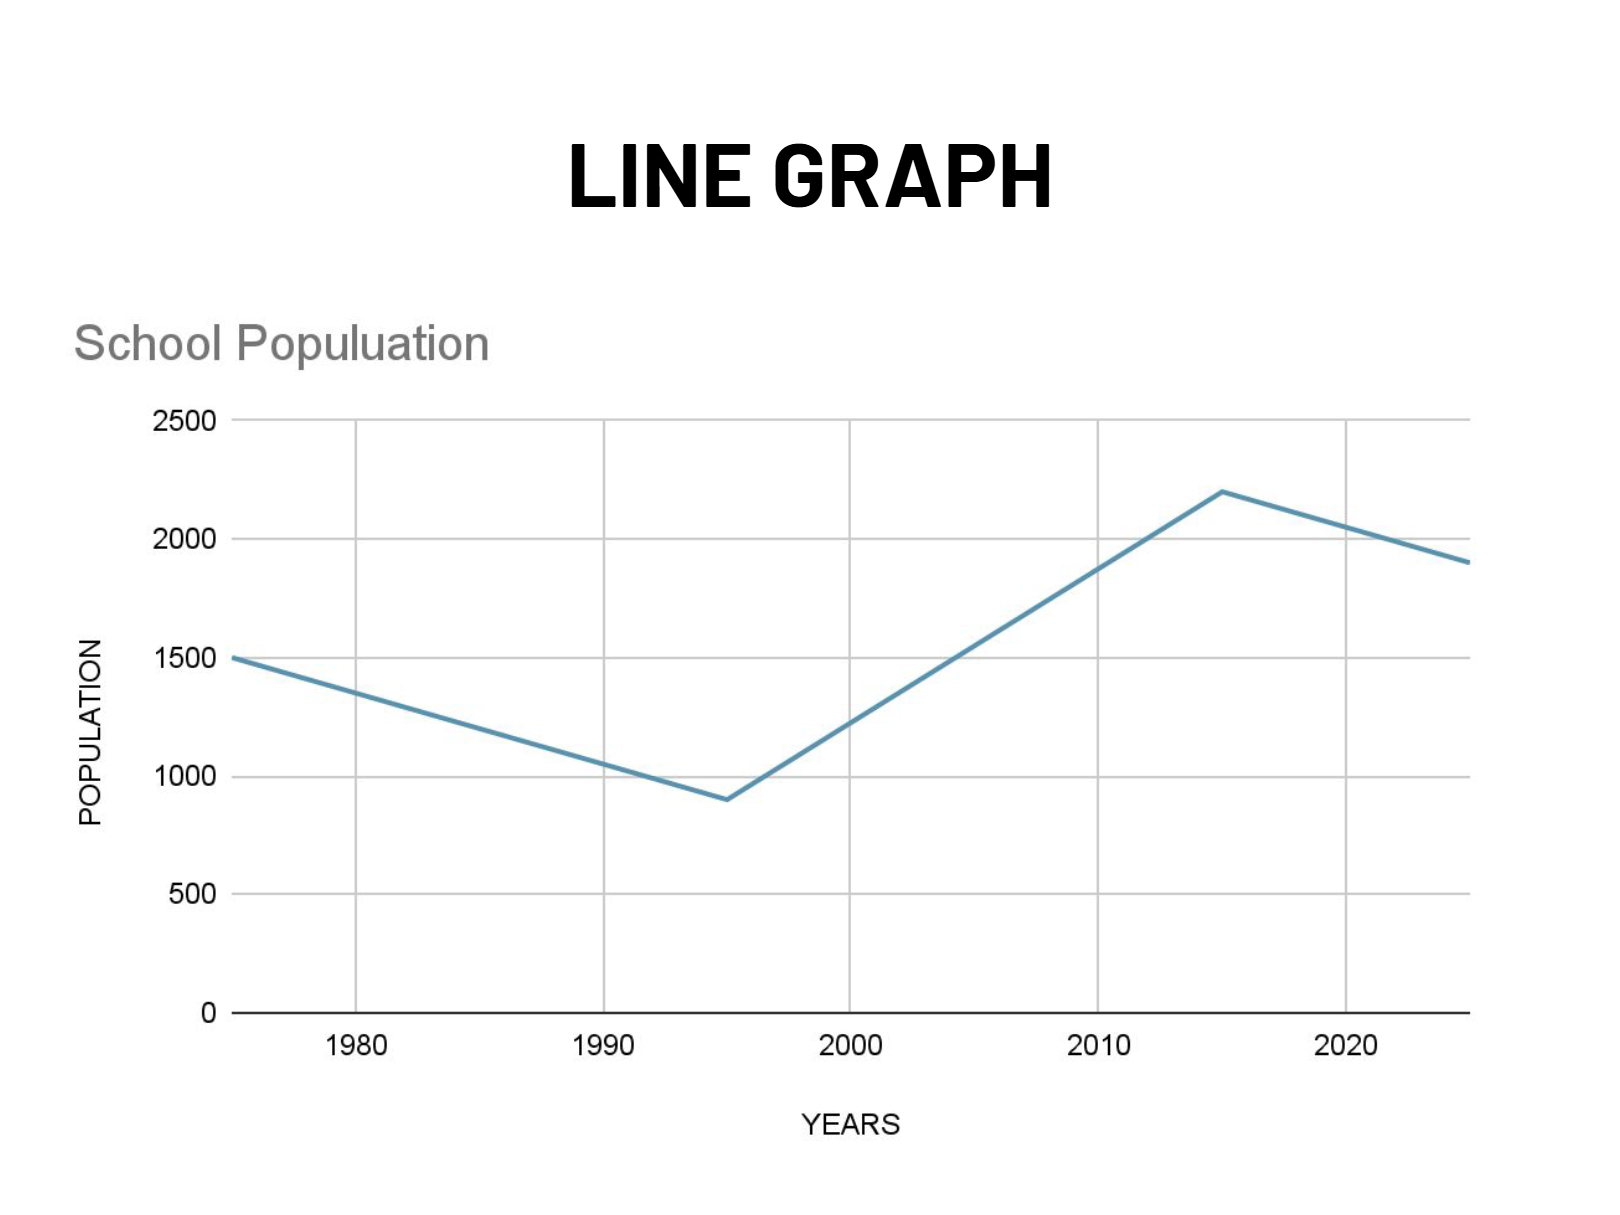
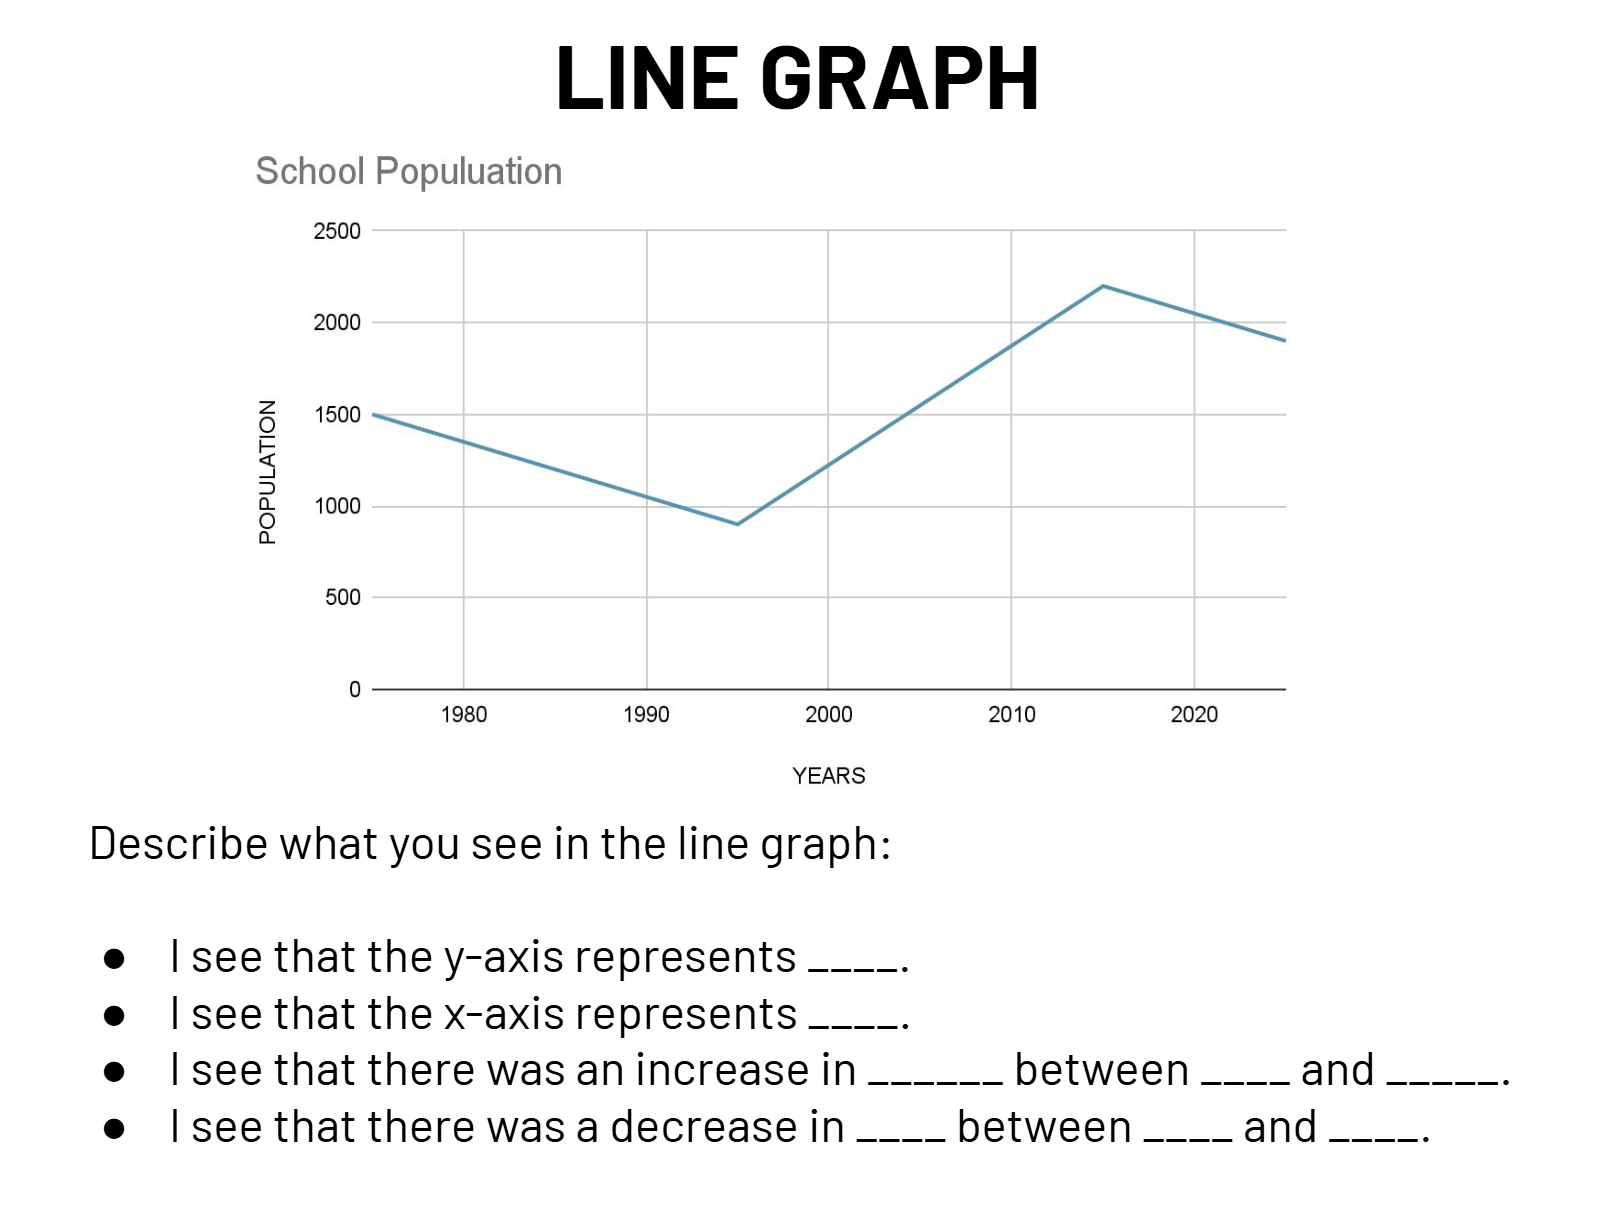
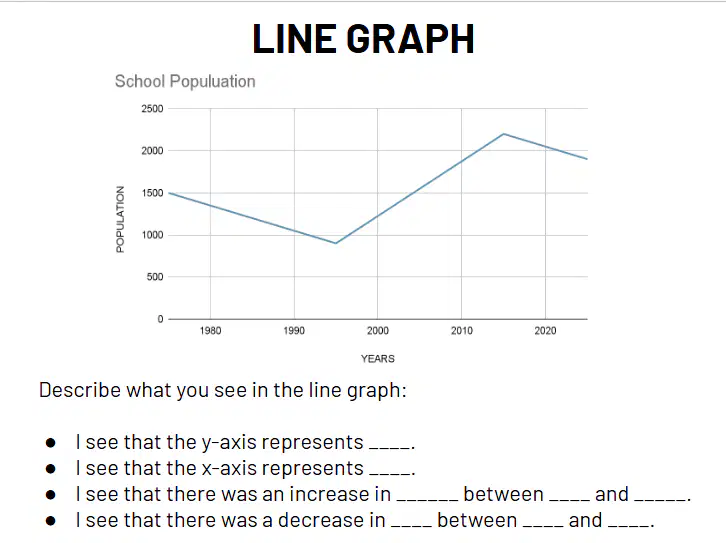
Describe the line graph.

20

media

21

Multiple Choice

Question image

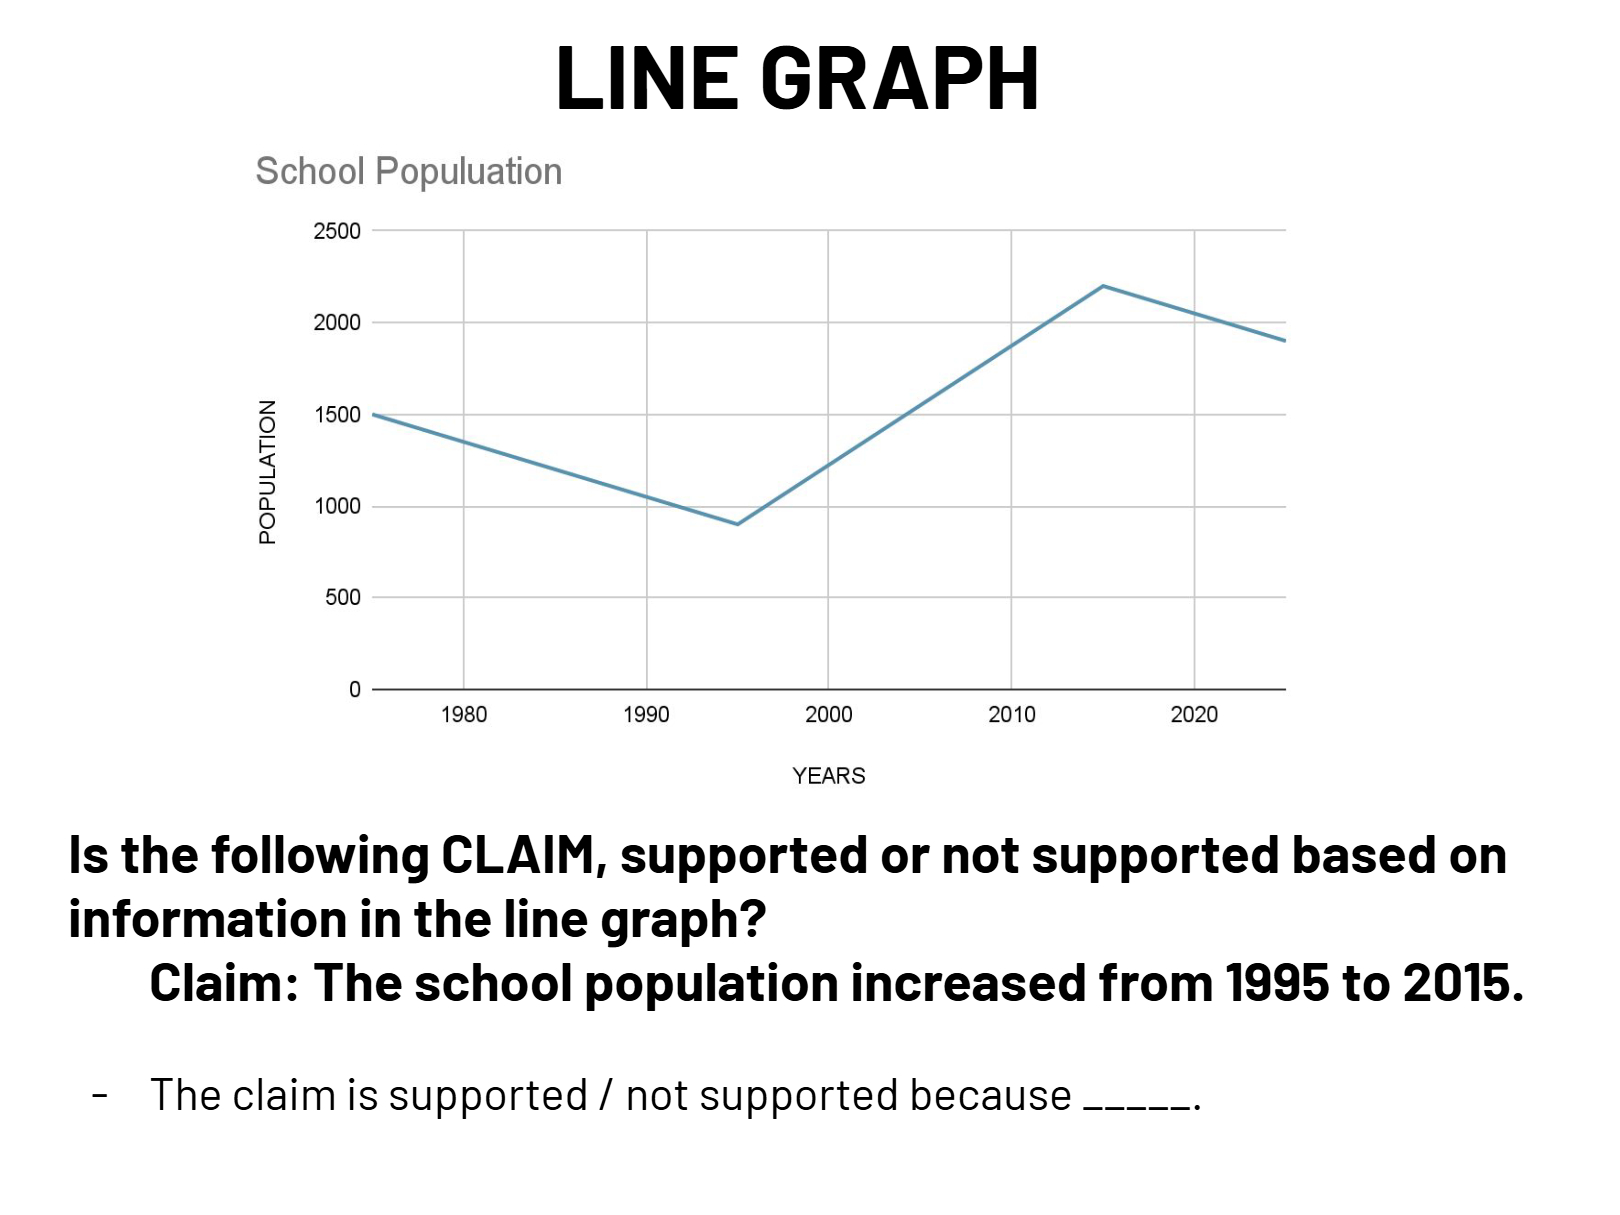
Is the following CLAIM, supported or not supported based on information in the line graph? Claim: The school population increased from 1995 to 2015. The claim is supported / not supported because _____.

1
supported because the line graph shows an increase in population from 1995 to 2015.
2

not supported because the populatio decreased between 1995 to 2015.

22

media

23

Multiple Choice

Based on the bar graph, which two beverages received fewer votes than Gatorade?

1

Water and Tea

2

Soda and Water

3

Tea and Soda

4

Gatorade and Tea

24

Multiple Choice

Which beverage received the most votes according to the bar graph?

1

Soda

2

Water

3

Gatorade

4

Tea

media

Show answer

Auto Play

Slide 1 / 24

SLIDE