
Reviewer - Stat & Prob
Presentation
•
Other
•
11th Grade
•
Practice Problem
•
Hard

Virginia Atiwag
Used 2+ times
FREE Resource
11 Slides • 27 Questions
1
Reviewer in Stat & Prob
Final Exam
2

3
Multiple Choice
It is a numerical quantity that is assigned to the outcome of an experiment.
probability
probability distribution
variable
random variable
4
Fill in the Blanks
5
Multiple Choice
What is the sum of the area that corresponds to the right of 0 and to the left of 0.
2
1.5
1
0.5
6
Multiple Choice
How many percents is the total area that corresponds to the right of 0 and to the left of 0?
25%
50%
75%
100%
7
Multiple Choice
What mathematical operation to use in getting values from the z table to find the area between two z values?
add
subtract
multiply
divide
8
Multiple Choice
What is another term of z-table?
Table of Contents
Table of Aras of Geometric Figure
Periodic Table of Element
Table of Areas Under Normal Curve
9
Multiple Choice
Which of the following is the measure of the number of standard deviation a particular data value is away from the mean?
Standardization
Mean
Variance
Random Normal Variable
10
Multiple Choice
Suppose the provincial health officer of Batangas reported that the average COVID19 positive for 40 days is 15 patients with the standard deviation of 4 patients. What is the z-score of 16 patients?
6.25
0.25
-1.25
0.75
11
Multiple Choice
What is another term used for standard normal score?
mean score
t-score
z-score
x-score
12
Multiple Choice
Find the sum of the areas under the standard normal curve to the left of z = -1.03 and to the right of z = 2.50.
0.1577
0.8423
0.9938
0.1515
13
Fill in the Blanks
14
Multiple Choice
What does P(a<Z<b) notation mean?
Probability of X that is in between two other z values a and b.
A.Probability of a normal random variable X that is in between two other normal random variables a and b
Probability of x that is in the opposite of a and b.
Probability of x that is in the right of a and b.
15
Multiple Choice
The ages of Senior High students enrolled at Grace Montessori School of Novaliches are normally distributed with a mean of 16 years and a standard deviation of 1.5 years. If a student is selected at random, what is the probability that his age is under 15 years?
0.2514
0.7485
0.2514
0.7517
16
Random Sampling
In research, collecting data can either be done in the entire population or the subset of this population called sample. If a researcher opts to use sample rather than a population, he must take considerations on the number of samples and how these samples can be chosen out of his target population.
A population includes all of its elements from a set of data. The size of the population is the number of observations in the population. For example, if ABS CBN network has 11,000 employees having the required blood type in a certain study, then we have a population of size 11,000.
Sample consists of one or more data drawn from the population. It is a subset, or an incomplete set taken from a population of objects or observations. Taking samples instead of the population is less time-consuming and cost-effective. Although sampling has advantages, it can also be a source of bias and inaccuracy.
Random Sampling is a sampling method of choosing representatives from the population wherein every sample has an equal chance of being selected. Accurate data can be collected using random sampling techniques.
17
The sampling techniques that involve random selection are called probability sampling. Likewise, simple random, systematic, and stratified and cluster sampling are all probability sampling techniques.
1. Simple random sampling
2. Systematic random sampling
3. Stratified random sampling
4. Cluster sampling
18
There are different types of random sampling.
A Simple random sampling technique is the most basic random sampling wherein each element in the population has an equal probability of being selected. They are usually represented by a written on equal-sized and unique identification number that is shaped papers and then selection of samples is possible through the lottery method. Random numbers selected to decide which elements are included as the sample. The drawing number of paper is based on the desired number of samples.
Example:
A researcher writes the name of each student on a piece of paper, mixes the papers in a bowl, and draws 7 pieces of paper.

19
Systematic random sampling is a random sampling that uses a list of all the elements in the population and then elements are being selected based on the kth consistent intervals. To get the kth interval, divide the population size by the sample size.
There are different types of random sampling.
Examples:
A researcher selects every 7th students from a random list. 3
A researcher tells the class to count and then selects those students who count a multiple of 7 numbers.

20
Stratified random sampling is a random sampling wherein the population is divided into different strata or divisions. The number of samples will be proportionately picked in each stratum that is why all strata are represented in the samples.
There are different types of random sampling.

Example:
A researcher separates the list of boys and girls, then draws 7 names by gender.
21
Cluster sampling is a random sampling wherein population is divided into clusters or groups and then the clusters are randomly selected. All elements of the clusters randomly selected are considered the samples of the study.
There are different types of random sampling.

Example:
A researcher surveys all students from 3 randomly selected classes out of 7 classes.
22
There are also sampling techniques that do not involve random selection of data. They are called non-probability sampling. An example of this is convenience sampling wherein the researcher gathers data from nearby sources of information exerting minimal effort.
Convenience is being used by persons giving questionnaires on the streets to ask the passers-by.
Purposive sampling is also not considered a random sampling since the respondents are being selected based on the goal of the studies of the researcher. If the study is about the students who are children of OFW, the researcher will get samples who are children of OFW. This excludes other students from being a sample.
23
Multiple Choice
Cluster sampling selects entire groups or clusters instead of individual members.
True
False
24
Multiple Choice
Random sampling ensures that every member of the population has an equal chance of being selected.
True
False
25
Multiple Choice
Probability sampling includes methods where random selection is used.
True
False
26
Multiple Choice
A population refers only to a small group selected from a larger set of data.
True
False
27
Multiple Choice
Using samples instead of the entire population can save time and cost.
True
False
28
Multiple Choice
Drawing names from a bowl is an example of simple random sampling.
True
False
29
Multiple Choice
Sampling always produces perfectly accurate results without any bias.
True
False
30
Multiple Choice
In cluster sampling, only a few individuals from each selected cluster are included.
True
False
31
Multiple Choice
In systematic sampling, elements are selected at fixed intervals from a list..
True
False
32
Multiple Choice
A sample is a complete set of all elements in a study.
True
False
33
Multiple Choice
Convenience and purposive sampling are examples of non-probability sampling.
True
False
34
Multiple Choice
Selecting students who count multiples of 7 is an example of systematic random sampling.
True
False
35
Multiple Choice
In systematic sampling, elements are selected at fixed intervals from a list.
True
False
36

37
Multiple Choice
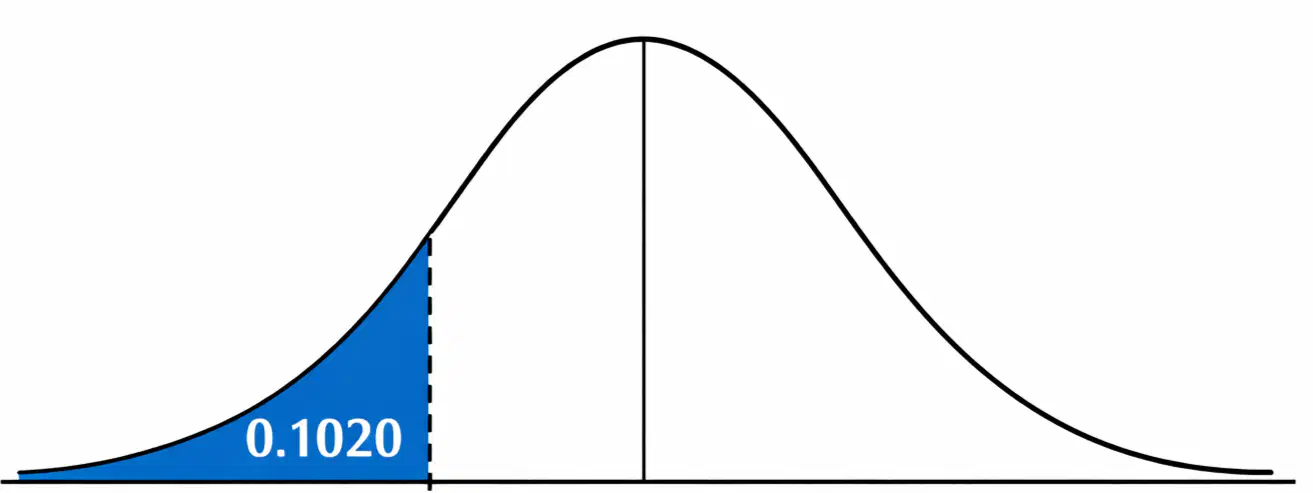
To lessen the number of non-numerates in Grace Montessori School of Novaliches, the Mathematics department implemented Project MEAN (Masterful Elimination of All Non-numerates). A student is required to undergo the program if he/she scored below 50 in the numeracy test. If the scores of the students in the numeracy test are normally distributed with a mean of 47.50 and a standard deviation of 5.5, what percentage of the students needed to undergo the program?
Approximately 25% of the students need to undergo the program.
Approximately 32.64% of the students need to undergo the program.
Approximately 67.36% of the students need to undergo the program.
Approximately 36.12% of the students need to undergo the program.
38

Reviewer in Stat & Prob
Final Exam
Show answer
Auto Play
Slide 1 / 38
SLIDE
Popular Resources on Wayground

16 questions
Grade 3 Simulation Assessment 2
Quiz
•
3rd Grade
19 questions
HCS Grade 5 Simulation Assessment_1 2526sy
Quiz
•
5th Grade
10 questions
Cinco de Mayo Trivia Questions
Interactive video
•
3rd - 5th Grade
17 questions
HCS Grade 4 Simulation Assessment_2 2526sy
Quiz
•
4th Grade
24 questions
HCS Grade 5 Simulation Assessment_2 2526sy
Quiz
•
5th Grade
13 questions
Cinco de mayo
Interactive video
•
6th - 8th Grade
20 questions
Math Review
Quiz
•
3rd Grade
30 questions
GVMS House Trivia 2026
Quiz
•
6th - 8th Grade
Discover more resources for Other
5 questions
A.EI.1-3 Quizizz Day 1
Quiz
•
9th - 12th Grade
210 questions
Unit 1 - 4 AP Bio Review
Quiz
•
9th - 12th Grade
100 questions
Biology EOC Review
Quiz
•
9th - 12th Grade
5 questions
A.EI.1-3 Quizizz Day 2
Quiz
•
9th - 12th Grade
5 questions
A.EI.1-3 Quizizz Day 4
Quiz
•
9th - 12th Grade
16 questions
AP Biology: Unit 1 Review (CED)
Quiz
•
9th - 12th Grade
5 questions
G.PC/DF Quizizz Day 2
Quiz
•
9th - 12th Grade
20 questions
verbos reflexivos en español
Quiz
•
9th - 12th Grade