
Normal Distributions Unit Review
11th Grade - University
•30 Qs

Similar activities
Asesmen Sumatif Harian
11th Grade
•25 Qs
XI - Trigonometry
11th Grade
•25 Qs
Enrichment A - Evaluate Functions - April 3
9th - 12th Grade
•25 Qs
Soal Matematika raya huluan
6th Grade - University
•25 Qs
Fungsi Kuadrat
9th - 12th Grade
•25 Qs
5.6 Types of Statistical Studies & Sampling
12th Grade
•25 Qs
Penugasan Matematika Wajib XI MIPA
11th Grade
•25 Qs
Potenze e logaritmi
8th - 11th Grade
•25 Qs

Normal Distributions Unit Review
Quiz
•
Mathematics
•
11th Grade - University
•
Medium
+1
Standards-aligned
Matthew Kilgore
Used 2+ times
FREE Resource
Enhance your content in a minute
30 questions
Show all answers
1.
MULTIPLE CHOICE QUESTION
15 mins • 1 pt
The z-score represents.....
2.
MULTIPLE CHOICE QUESTION
15 mins • 1 pt
If we say that "a" is the bth percentile, that means...
Tags
CCSS.6.SP.B.5C
3.
MULTIPLE CHOICE QUESTION
15 mins • 1 pt
What shape is a normal distribution curve?
4.
MULTIPLE CHOICE QUESTION
15 mins • 1 pt
What is the the total area under the standard normal distribution curve?
Tags
CCSS.7.SP.C.7A
5.
MULTIPLE CHOICE QUESTION
15 mins • 1 pt
Who discovered the Normal Distribution?
6.
MULTIPLE CHOICE QUESTION
1 min • 1 pt
The average waist size for teenage males is 29 inches with a standard deviation of 2 inches. What is the z-score of a teenage male with a 33 inch waist?
Tags
CCSS.HSS.ID.A.4
7.
MULTIPLE CHOICE QUESTION
15 mins • 1 pt
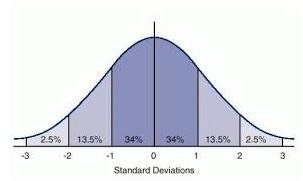
The mean life of a tire is 30,000 km. The standard deviation is 2000 km. The lifespan of these tires approximates a normal distribution.
Therefore, around 68% of all tires will have a life between ___________ km and __________ km.
Tags
CCSS.HSS.ID.A.4
Access all questions and much more by creating a free account
Create resources
Host any resource
Get auto-graded reports
Continue with Google

Continue with Email
Continue with Classlink
Continue with Clever
or continue with
Microsoft
%20(1).png)
Apple
Others
Already have an account?
Similar Resources on Wayground
25 questions
"Жас математик" олимпиада. 11 сынып
Quiz
•
11th Grade
25 questions
3-D shapes (basic to higher)
Quiz
•
9th - 12th Grade
25 questions
Вечеринка 2
Quiz
•
6th - 12th Grade
25 questions
time units
Quiz
•
3rd - 12th Grade
25 questions
Number Patterns and Sequences
Quiz
•
11th Grade
30 questions
V-ACT Aptitude Test-1, 2021-22-MBA
Quiz
•
University
26 questions
INDEFINITE INTEGRAL
Quiz
•
12th Grade
25 questions
UJIAN SEKOLAH MATEMATIKA A7
Quiz
•
9th - 12th Grade
Popular Resources on Wayground
15 questions
Fractions on a Number Line
Quiz
•
3rd Grade
20 questions
Equivalent Fractions
Quiz
•
3rd Grade
25 questions
Multiplication Facts
Quiz
•
5th Grade
22 questions
fractions
Quiz
•
3rd Grade
20 questions
Main Idea and Details
Quiz
•
5th Grade
20 questions
Context Clues
Quiz
•
6th Grade
15 questions
Equivalent Fractions
Quiz
•
4th Grade
20 questions
Figurative Language Review
Quiz
•
6th Grade