Coefficient of Determination Practice
Authored by Robbie Centracchio
Mathematics
8th Grade
CCSS covered
Used 42+ times

AI Actions
Add similar questions
Adjust reading levels
Convert to real-world scenario
Translate activity
More...
Content View
Student View
21 questions
Show all answers
1.
MULTIPLE CHOICE QUESTION
30 sec • 1 pt
A study compared the number of years of education and a person's annual salary. The correlation coefficient of the data was r = 0.913. What is the coefficient of determination?
0.834
0.887
0.457
0.913
Tags
CCSS.HSS.ID.C.8
2.
MULTIPLE CHOICE QUESTION
30 sec • 1 pt

The relationship ship between a woman's show size and length of her foot, in inches, is given in the table.
Calculate the coefficient of determination
1.5
0.75
1
0.5
3.
MULTIPLE CHOICE QUESTION
30 sec • 1 pt

As shown in the table, a person's target heart rate during exercise changes as the person gets older. Use the graphing calculator to find the coefficient of determination.
-0.999
-0.664
0.998
1.503
Tags
CCSS.HSS.ID.C.8
4.
MULTIPLE CHOICE QUESTION
30 sec • 1 pt

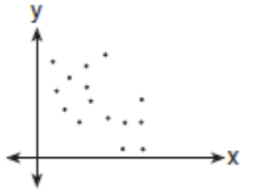
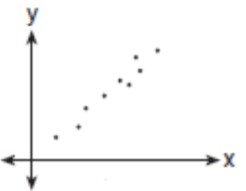
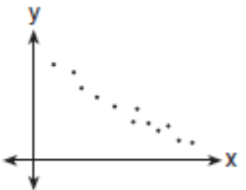
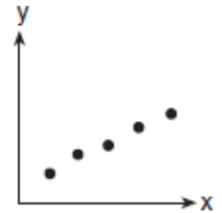
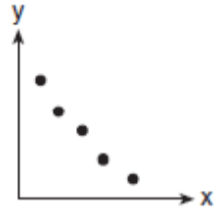
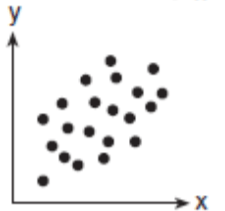
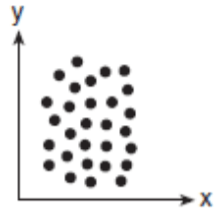
What is the coefficient of determination for the data characteristics shown?
-.928
.928
.861
-.861
Tags
CCSS.HSS.ID.C.8
5.
MULTIPLE CHOICE QUESTION
30 sec • 1 pt

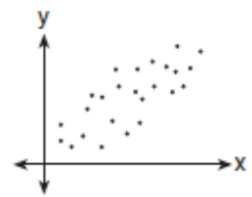
What COULD be the approximate value of the correlation coefficient for the scatter plot?
-.851
-.162
0.211
0.905
Tags
CCSS.HSS.ID.C.8
CCSS.HSS.ID.B.6
6.
MULTIPLE CHOICE QUESTION
30 sec • 1 pt
If the coefficient of determination is 0.876, what percent of the variation is explained?
56%
88%
-67%
92%
Tags
CCSS.HSS.ID.B.6B
7.
MULTIPLE CHOICE QUESTION
30 sec • 1 pt
When if ever, would the correlation coefficient (r) be equal to the coefficient of determination (r squared)?
when the correlation is perfect (r=1)
they never will
when the correlation is somewhat strong
when there exists no correlation
Tags
CCSS.HSS.ID.C.8
CCSS.HSS.ID.B.6
CCSS.HSS.ID.C.9
Access all questions and much more by creating a free account
Create resources
Host any resource
Get auto-graded reports

Continue with Google

Continue with Email

Continue with Classlink

Continue with Clever
or continue with

Microsoft
%20(1).png)
Apple
Others
Already have an account?
Similar Resources on Wayground

20 questions
Nivel I Olimpiadas
Quiz
•
7th - 10th Grade

21 questions
brainrot
Quiz
•
6th - 8th Grade

20 questions
Números Enteros
Quiz
•
7th - 8th Grade

20 questions
Mineduc D
Quiz
•
7th - 12th Grade

16 questions
Enters (Easy)
Quiz
•
7th - 12th Grade

20 questions
Математикалық сауаттылық
Quiz
•
1st Grade - Professio...

18 questions
TOFAS: Operations on Integers
Quiz
•
6th - 8th Grade

20 questions
week 5 online weekend homework (quizzez)
Quiz
•
8th Grade
Popular Resources on Wayground

7 questions
History of Valentine's Day
Interactive video
•
4th Grade

15 questions
Fractions on a Number Line
Quiz
•
3rd Grade

20 questions
Equivalent Fractions
Quiz
•
3rd Grade

25 questions
Multiplication Facts
Quiz
•
5th Grade

22 questions
fractions
Quiz
•
3rd Grade

15 questions
Valentine's Day Trivia
Quiz
•
3rd Grade

20 questions
Main Idea and Details
Quiz
•
5th Grade

20 questions
Context Clues
Quiz
•
6th Grade
Discover more resources for Mathematics

20 questions
Laws of Exponents
Quiz
•
8th Grade

20 questions
Graphing Inequalities on a Number Line
Quiz
•
6th - 9th Grade

16 questions
2022 Winter Olympics Medal Table
Passage
•
6th - 8th Grade

20 questions
Complementary Supplementary Vertical Adjacent Angles
Quiz
•
8th Grade

20 questions
One Step equations addition and subtraction
Quiz
•
5th - 8th Grade

12 questions
Volume of cones and cylinders
Quiz
•
8th Grade

20 questions
Slope from a Graph
Quiz
•
8th Grade

15 questions
Combine Like Terms and Distributive Property
Quiz
•
8th - 9th Grade


