Unit 3 Statistics, Graphs and Charts
Quiz
•
Mathematics
•
7th - 11th Grade
•
Practice Problem
•
Medium
+9
Standards-aligned
PAUL BLACKLEDGE
Used 18+ times
FREE Resource
Enhance your content in a minute
21 questions
Show all answers
1.
MULTIPLE CHOICE QUESTION
3 mins • 1 pt

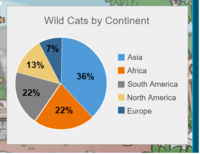
What is name of the chart pictured below?
Line Graph
Pie Chart
Bar Graph
Line Plot
Tags
CCSS.6.SP.B.4
2.
MULTIPLE CHOICE QUESTION
3 mins • 1 pt

Which Continent has the smallest % of wild cats?
Tags
CCSS.2.MD.D.9
3.
MULTIPLE CHOICE QUESTION
3 mins • 1 pt

More people like oranges than pears.
More people like pears than melons.
The number of people who like oranges and pears are equal.
The number of people who like apples and oranges are equal.
Tags
CCSS.6.SP.A.1
CCSS.6.SP.A.2
CCSS.6.SP.B.5
4.
MULTIPLE CHOICE QUESTION
3 mins • 1 pt

$20
$25
$50
$100
Tags
CCSS.6.RP.A.3C
5.
MULTIPLE CHOICE QUESTION
3 mins • 1 pt

What percentage of girls have blonde hair?
Tags
CCSS.6.SP.A.1
CCSS.6.SP.A.2
CCSS.6.SP.A.3
CCSS.6.SP.B.5
6.
MULTIPLE CHOICE QUESTION
3 mins • 1 pt

How many females were surveyed?
45
73
16
12
Tags
CCSS.HSN.VM.C.6
7.
MULTIPLE CHOICE QUESTION
3 mins • 1 pt

According to the two-way table, a person who plays an instrument is most likely to:
Tags
CCSS.6.SP.A.1
CCSS.6.SP.A.2
CCSS.6.SP.B.5
Create a free account and access millions of resources
Create resources
Host any resource
Get auto-graded reports

Continue with Google

Continue with Email

Continue with Classlink

Continue with Clever
or continue with

Microsoft
%20(1).png)
Apple
Others
Already have an account?
Similar Resources on Wayground

20 questions
Addition and Multiplication Properties
Quiz
•
9th - 12th Grade

16 questions
All about numbers!
Quiz
•
7th Grade

20 questions
Scientific Notation
Quiz
•
7th Grade

20 questions
cls(C.m.bramdik)10
Quiz
•
10th Grade

20 questions
Introduction to integers
Quiz
•
7th Grade

21 questions
brainrot
Quiz
•
6th - 8th Grade

20 questions
TEST OF AREAS AND PERIMETERS
Quiz
•
6th - 7th Grade

18 questions
TOFAS: Operations on Integers
Quiz
•
6th - 8th Grade
Popular Resources on Wayground

5 questions
This is not a...winter edition (Drawing game)
Quiz
•
1st - 5th Grade

15 questions
4:3 Model Multiplication of Decimals by Whole Numbers
Quiz
•
5th Grade

25 questions
Multiplication Facts
Quiz
•
5th Grade

10 questions
The Best Christmas Pageant Ever Chapters 1 & 2
Quiz
•
4th Grade

12 questions
Unit 4 Review Day
Quiz
•
3rd Grade

10 questions
Identify Iconic Christmas Movie Scenes
Interactive video
•
6th - 10th Grade

20 questions
Christmas Trivia
Quiz
•
6th - 8th Grade

18 questions
Kids Christmas Trivia
Quiz
•
KG - 5th Grade
Discover more resources for Mathematics

10 questions
Identify Iconic Christmas Movie Scenes
Interactive video
•
6th - 10th Grade

15 questions
Solving Equations with Variables on Both Sides Review
Quiz
•
8th Grade

15 questions
scatter plots and trend lines
Quiz
•
8th Grade

20 questions
Solving Systems of Equations by Graphing
Quiz
•
8th Grade

15 questions
Christmas Movie Trivia
Quiz
•
7th Grade

20 questions
Slope from a Graph
Quiz
•
8th Grade

20 questions
Scatter Plots and Line of Best Fit
Quiz
•
8th Grade

20 questions
One-Step Inequalities
Quiz
•
7th Grade


