Supply and Demand
Social Studies
9th - 12th Grade

AI Actions
Add similar questions
Adjust reading levels
Convert to real-world scenario
Translate activity
More...
Content View
Student View
17 questions
Show all answers
1.
MULTIPLE CHOICE QUESTION
30 sec • 5 pts

What does this curve represent?
2.
MULTIPLE CHOICE QUESTION
30 sec • 1 pt
New robot increase efficiency for Autos. Which diagram shows this?


3.
MULTIPLE CHOICE QUESTION
30 sec • 5 pts

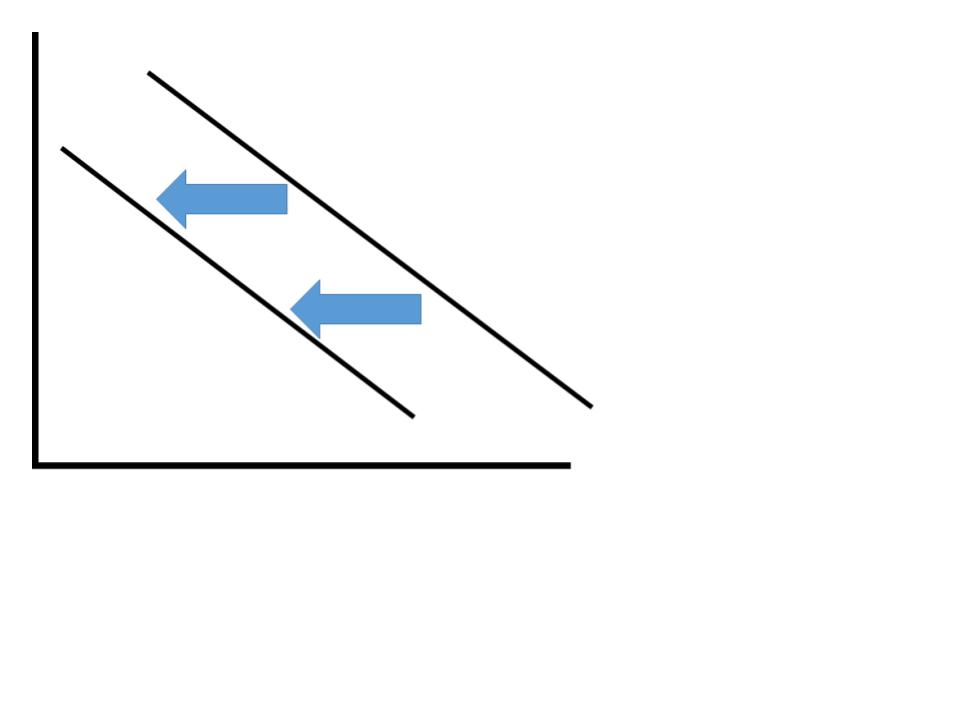
This graph represents...?
Changes in quantity demanded
Changes in quantity supplied
Changes in demand
Changes in supply
4.
MULTIPLE CHOICE QUESTION
30 sec • 1 pt

What does this curve represent?
5.
MULTIPLE CHOICE QUESTION
30 sec • 1 pt
Example of Changes in Complimentary goods practice: If the price of Peanut Butter decreases, the demand for Jelly will...
Increase
Decrease
Stay the Same
6.
MULTIPLE CHOICE QUESTION
30 sec • 1 pt

The graph with a shift to the right on the "S" line represents
No change in supply
A decrease in supply
An increase in supply
A change in demand
7.
MULTIPLE CHOICE QUESTION
30 sec • 1 pt

What does the red solid line on the graph show?
Shortage
Surplus
Supply Table
Equilibrium
Access all questions and much more by creating a free account
Create resources
Host any resource
Get auto-graded reports
Continue with Google

Continue with Email
Continue with Classlink
Continue with Clever
or continue with
Microsoft
%20(1).png)
Apple
Others
Already have an account?
Similar Resources on Wayground

20 questions
ENLIGHTENMENT THINKERS
Quiz
•
9th - 12th Grade
15 questions
President Trivia
Quiz
•
9th - 12th Grade
13 questions
Comment le marché concurrentiel fonctionne-t-il?
Quiz
•
8th Grade - University
12 questions
Microeconomic reform
Quiz
•
12th Grade
15 questions
The Great Depression
Quiz
•
10th - 12th Grade
20 questions
Southeast Asia
Quiz
•
7th - 9th Grade
20 questions
Milton Keynes
Quiz
•
10th - 12th Grade
18 questions
The World's Wife review
Quiz
•
11th - 12th Grade
Popular Resources on Wayground
7 questions
History of Valentine's Day
Interactive video
•
4th Grade
15 questions
Fractions on a Number Line
Quiz
•
3rd Grade
20 questions
Equivalent Fractions
Quiz
•
3rd Grade
25 questions
Multiplication Facts
Quiz
•
5th Grade
22 questions
fractions
Quiz
•
3rd Grade
15 questions
Valentine's Day Trivia
Quiz
•
3rd Grade
20 questions
Main Idea and Details
Quiz
•
5th Grade
20 questions
Context Clues
Quiz
•
6th Grade
Discover more resources for Social Studies
5 questions
Trigger Events of the 1850's
Interactive video
•
11th Grade
6 questions
Dred Scott Reading Quiz
Passage
•
11th Grade
16 questions
USHC 4.8 Immigration and Urbanization
Quiz
•
9th - 12th Grade
26 questions
Unit 2: Federalism
Quiz
•
9th Grade
15 questions
Imperialism Quizizz
Quiz
•
11th Grade
32 questions
Unit 7 Review
Quiz
•
10th Grade
10 questions
Exploring the Executive Branch and Presidential Powers
Interactive video
•
6th - 10th Grade
10 questions
Trigger Events of the Civil War
Flashcard
•
11th Grade