Frequency polygons and pie charts
Authored by Natasha Wildy
Mathematics
9th Grade
CCSS covered
Used 7+ times

AI Actions
Add similar questions
Adjust reading levels
Convert to real-world scenario
Translate activity
More...
Content View
Student View
10 questions
Show all answers
1.
MULTIPLE CHOICE QUESTION
30 sec • 1 pt

32 people went to a ice hockey match. The pie chart shows the colours of their shirts. How many people wore black?
45
1
4
Tags
CCSS.7.EE.B.3
2.
MULTIPLE CHOICE QUESTION
30 sec • 1 pt
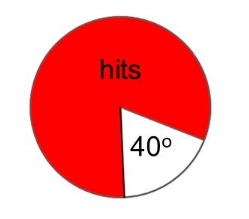
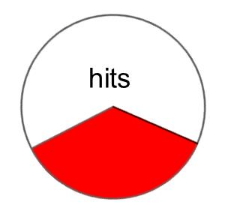
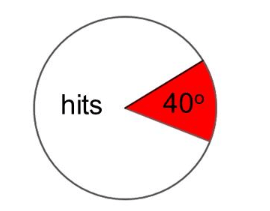
A darts player hits his target 40% of the time. Which pie chart represents his hits and misses?

3.
MULTIPLE CHOICE QUESTION
30 sec • 1 pt

This pie chart shows the colour of hats that Tim owns. What fraction of Tim's hats are blue?
impossible to say
Tags
CCSS.3.NF.A.1
CCSS.3.NF.A.2B
4.
MULTIPLE CHOICE QUESTION
2 mins • 1 pt

There are 200 vegetable plants in a garden. How many of the vegetable plants are green beans?
Tags
CCSS.6.RP.A.3C
5.
MULTIPLE CHOICE QUESTION
1 min • 1 pt

What percentage of the houses are semi-detached?
60%
40%
33%
Tags
CCSS.2.MD.D.9
6.
MULTIPLE CHOICE QUESTION
1 min • 1 pt

What is the most number of times that someone visited the cinema?
5
1
35
2
7.
MULTIPLE CHOICE QUESTION
45 sec • 1 pt

What is the highest number of goals scored?
5
8
1
6


Access all questions and much more by creating a free account
Create resources
Host any resource
Get auto-graded reports
Continue with Google

Continue with Email
Continue with Microsoft
or continue with

%20(1).png)
Apple
Others
Already have an account?
