MA - Presenting Information
Authored by PFC Education
Other
Professional Development
Used 4+ times

AI Actions
Add similar questions
Adjust reading levels
Convert to real-world scenario
Translate activity
More...
Content View
Student View
25 questions
Show all answers
1.
MULTIPLE CHOICE QUESTION
3 mins • 1 pt

The table below shows a company's sales figures for the first six months of the year.
What kind of graph or chart would you use to show the fluctuations of total monthly sales figures across the six months?
Percentage component bar chart
Scatter diagram
Line graph
Pie chart
2.
MULTIPLE CHOICE QUESTION
2 mins • 1 pt
Which of the following would be best suited to represent the relationship between a company’s advertising expenditure and its sales revenue?
1. A pie chart
2. A bar chart
3. A scatter graph
1 only
2 only
3 only
2 and 3
3.
MULTIPLE CHOICE QUESTION
30 sec • 1 pt

The following bar chart shows the overhead expenses for a business for each quarter of 20X1
What was the reduction in overhead expenses between quarter three and quarter four?
$12,00,000
$800,000
$400,000
$40,000
4.
MULTIPLE CHOICE QUESTION
30 sec • 5 pts
The cost of materials for product A are as follows. Material W: $2,250
Material X: $3,000
Material Y: $3,600
Material Z: $150
If the material proportions were displayed on a pie chart, how many degrees would material Y represent?
1400 degrees
44 degrees
140 degrees
144 degrees
5.
MULTIPLE CHOICE QUESTION
3 mins • 1 pt

Based on the graph, which TWO of the following statements are correct? Statement 1 - At a level of activity of 30 units the total cost is $350
Statement 2 - The fixed element of the cost is $200
Statement 3 - The cost appears to be non-linear
Statement 4 - The variable element of the cost is $10 per unit
1 & 2
3 & 4
2 & 4
1 & 4
6.
MULTIPLE CHOICE QUESTION
30 sec • 1 pt
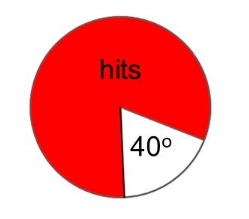
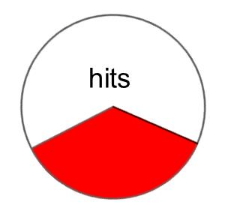
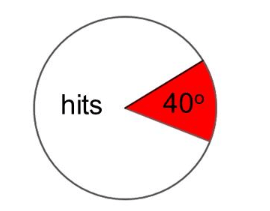
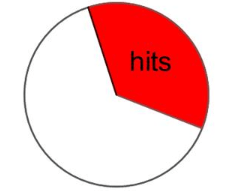
A darts player hits his target 40% of the time. Which pie chart represents his hits and misses?
7.
MULTIPLE CHOICE QUESTION
30 sec • 1 pt
People from Iceland were asked to pick their favourite from: lamb, fish and hot dog. A pie chart was made and 270 degrees represented lamb. What does this mean?
hot dogs are the least preferred food
25% of the people don't like lamb
lamb is the most preferred food
270% of the people prefer lamb


Access all questions and much more by creating a free account
Create resources
Host any resource
Get auto-graded reports
Continue with Google

Continue with Email
Continue with Microsoft
or continue with

%20(1).png)
Apple
Others
Already have an account?
