Mathematics
6th Grade
CCSS covered
Used 142+ times

AI Actions
Add similar questions
Adjust reading levels
Convert to real-world scenario
Translate activity
More...
Content View
Student View
20 questions
Show all answers
1.
MULTIPLE CHOICE QUESTION
5 mins • 5 pts

What percent of the annual sales were washers?
20%
30%
25%
0.20%
2.
MULTIPLE CHOICE QUESTION
30 sec • 5 pts

32 people went to a ice hockey match. The pie chart shows the colours of their shirts. How many people wore black?
45
1
4
3.
MULTIPLE CHOICE QUESTION
30 sec • 5 pts
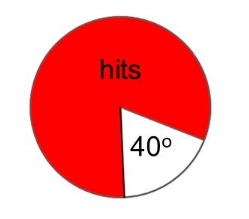
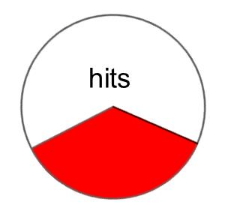
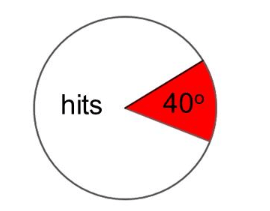
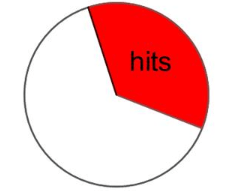
A darts player hits his target 40% of the time. Which pie chart represents his hits and misses?
4.
MULTIPLE CHOICE QUESTION
45 sec • 5 pts

What is the ratio of tables to chairs?
3:1
3:4
Tags
CCSS.6.RP.A.1
CCSS.6.RP.A.2
5.
MULTIPLE CHOICE QUESTION
30 sec • 5 pts

The pie chart shows colours of motorbikes in a shop. There are 20 more blue bikes than white. How many bikes are there altogether?
54
160
40
80
Tags
CCSS.2.MD.D.9
6.
MULTIPLE CHOICE QUESTION
30 sec • 5 pts
People from Iceland were asked to pick their favourite from: lamb, fish and hot dog. A pie chart was made and 270 degrees represented lamb. What does this mean?
hot dogs are the least preferred food
25% of the people don't like lamb
lamb is the most preferred food
270% of the people prefer lamb
7.
MULTIPLE CHOICE QUESTION
1 min • 5 pts

pie chart shows how a group of pupils travel to school.
how many pupils go to school by bus?
8
16
4
8


Access all questions and much more by creating a free account
Create resources
Host any resource
Get auto-graded reports
Continue with Google

Continue with Email
Continue with Microsoft
or continue with

%20(1).png)
Apple
Others
Already have an account?
